In today’s hyper-connected enterprise, network performance is synonymous with business performance. Downtime isn’t just an inconvenience; it’s a direct threat to revenue, reputation, and operational continuity. For IT professionals, moving beyond a reactive, break-fix mentality is a mission-critical objective. True network mastery lies in proactive visibility, intelligent automation, and a strategic approach to data.
This guide moves past generic advice to deliver actionable network monitoring best practices for building a resilient, efficient, and secure infrastructure. We will explore eight critical strategies designed for complex, real-world environments, providing the technical details needed for immediate implementation.
You will learn how to:
- Establish a comprehensive network baseline to define normal operational parameters.
- Implement proactive alerting and intelligent threshold management to reduce MTTR.
- Leverage real-time traffic analysis and centralized logging for deep visibility into packet flows and events.
- Integrate automation for swift response and remediation.
We will cover the specific, practical steps that elevate your monitoring from a simple utility to a strategic operational asset. Forget surface-level tips; this is a blueprint for achieving robust network control and operational excellence.
1. Establish a Comprehensive Network Baseline
The foundation of any effective network monitoring strategy is a meticulously established performance baseline. A baseline is not merely a snapshot; it’s a comprehensive, data-driven portrait of your network’s typical behavior over time. It documents key performance indicators (KPIs) like latency, jitter, packet loss, bandwidth utilization, and device CPU/memory loads under normal operating conditions. Without this crucial reference point, distinguishing between a genuine anomaly and a normal fluctuation becomes a matter of guesswork, not data.
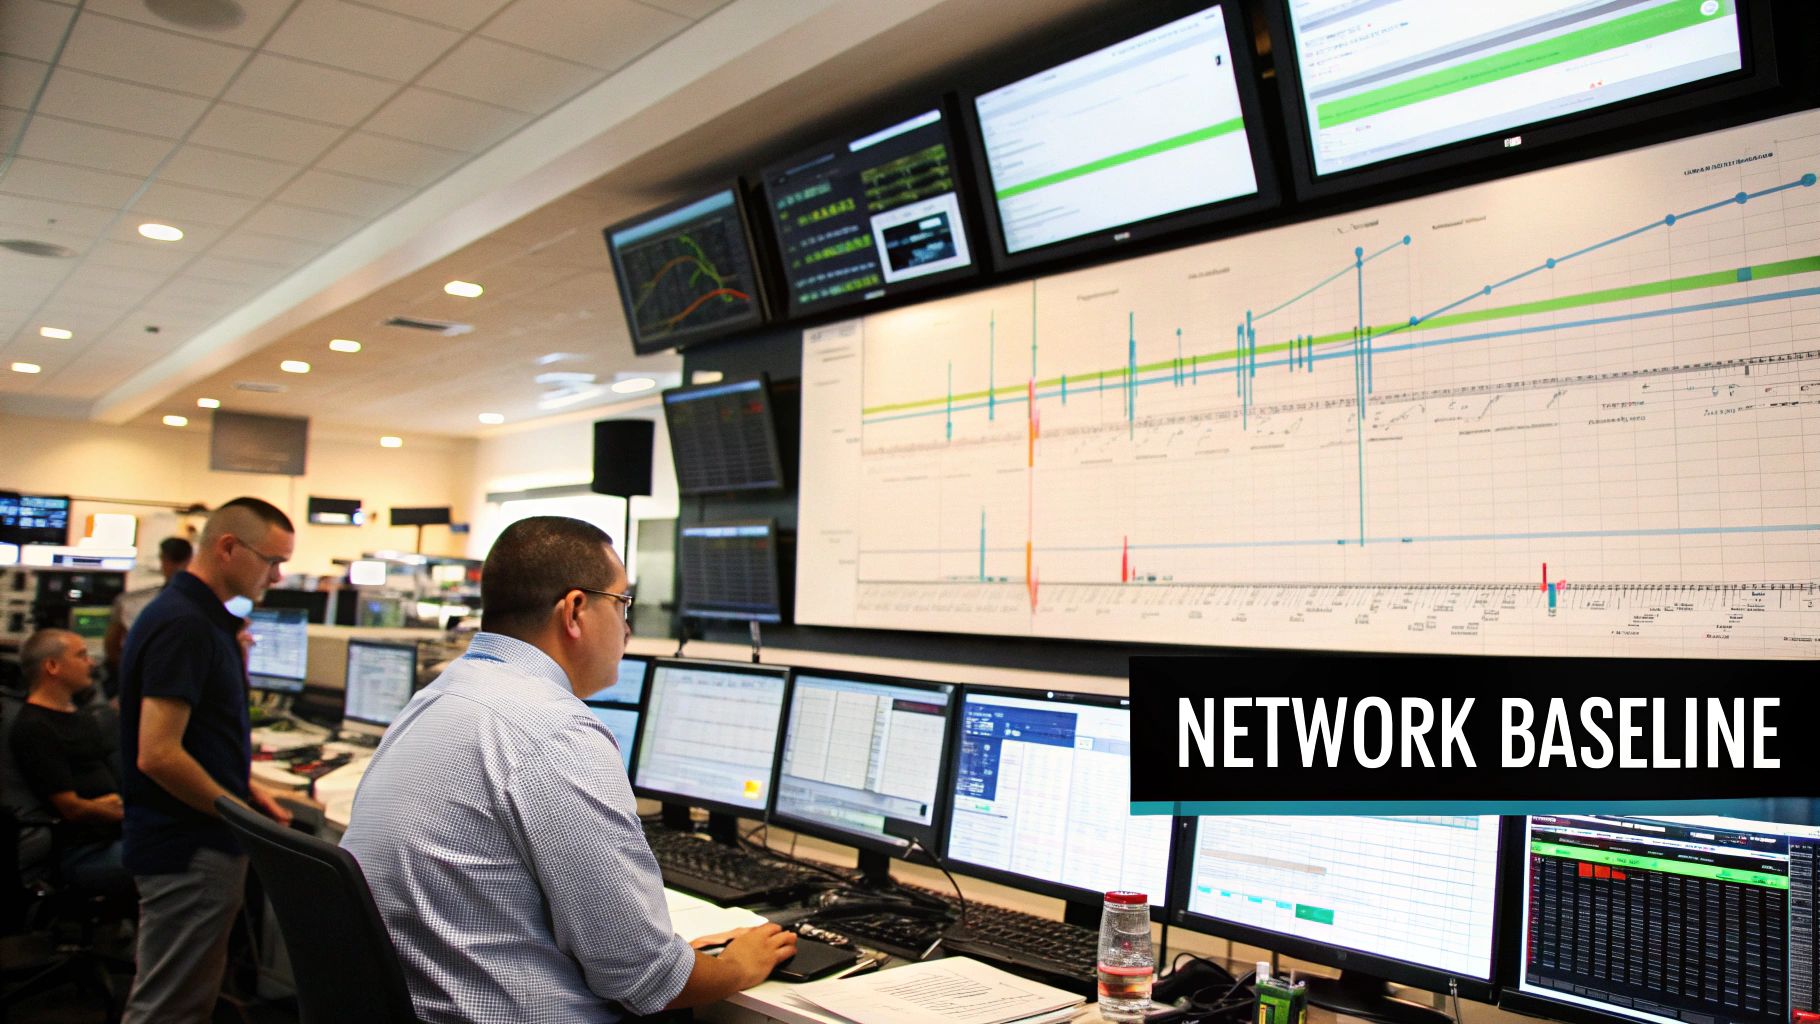
This practice is fundamental because it transforms monitoring from a reactive exercise into a proactive one. When you know what “normal” looks like, deviations immediately stand out, enabling faster incident detection and response. This data is also invaluable for strategic planning, helping you justify infrastructure upgrades and accurately forecast capacity needs. For instance, a cloud provider like AWS establishes rigorous baselines to ensure they meet customer Service Level Agreements (SLAs), while a media giant like Netflix uses them to predict and scale its Content Delivery Network (CDN) capacity ahead of demand spikes.
Actionable Implementation Tips
To move from theory to practice, follow these structured steps:
- Segment Your Network: Do not create a single, monolithic baseline. Instead, establish separate baselines for critical segments like the data center core, WAN links, specific office LANs, and cloud environments. Each segment has a unique traffic profile.
- Capture Diverse Timeframes: Collect data during various business cycles. This includes peak work hours, off-peak hours, nightly backup windows, and month-end processing. A comprehensive picture requires capturing the full spectrum of your operational tempo.
- Automate Data Collection: Manually gathering this data is impractical. Leverage your network monitoring system (NMS) to continuously collect and log metrics via SNMP, NetFlow, sFlow, or API calls.
- Document Business Context: A spike in latency is just a number. But a spike in latency that coincides with the marketing team’s weekly video upload provides actionable context. Document the “why” behind the data patterns.
- Schedule Regular Updates: A baseline is a living document. It must be updated quarterly or, more importantly, after any significant network change, such as adding a new application, onboarding a new office, or a major hardware refresh. This ensures it remains an accurate benchmark.
2. Implement Proactive Alerting and Threshold Management
Moving beyond basic up/down monitoring, proactive alerting transforms your system from a passive observer into an intelligent early warning system. This practice involves setting smart thresholds and correlation rules that notify administrators before minor performance degradation escalates into a major outage. Instead of relying on static, absolute values, it leverages dynamic thresholds, trend analysis, and contextual awareness to identify genuine threats while minimizing the “alert fatigue” caused by false positives.
This methodology is crucial for maintaining service levels and operational continuity. It allows IT teams to shift from firefighting to preemptive problem-solving, directly impacting uptime and user experience. For example, financial institutions like JPMorgan Chase deploy sophisticated alerting on their trading platforms where milliseconds of latency can have significant financial consequences. Similarly, Google’s Site Reliability Engineering (SRE) teams have popularized using error budgets and predictive alerting to maintain exceptionally high availability for their global services, a core tenet of modern network monitoring best practices.
Actionable Implementation Tips
To build a truly proactive alerting framework, consider these specific steps:
- Start with Baselines, Not Guesses: Use the data from your established network baseline to set initial thresholds. Begin with vendor-recommended settings but quickly adjust them based on your network’s unique, observed behavior.
- Use Percentage-Based Thresholds: Instead of alerting when a WAN link hits a static 80 Mbps, trigger an alert when it exceeds 90% of its average peak utilization. This dynamic approach adapts to normal fluctuations and is more effective at catching true anomalies.
- Implement Alert Correlation and Suppression: A single switch failure can trigger hundreds of alerts from downstream devices. Use a monitoring tool that can correlate these events, identifying the root cause and suppressing the symptomatic noise so your team can focus on the actual problem.
- Create Tiered and Time-Based Profiles: Not all alerts are equal. Create different profiles for different systems or times of day. A spike in CPU on a non-critical server at 3 a.m. during a backup window may not require an immediate page, but the same spike on a production database server at 10 a.m. certainly does.
- Conduct Regular Alert Tuning: Treat your alert rules as living configurations. Schedule quarterly reviews to analyze false positive and false negative rates. If an alert consistently fires without requiring action, it needs to be adjusted or removed.
3. Deploy Network Monitoring Across All Critical Points
Comprehensive network visibility is not achieved by chance; it requires the strategic placement of monitoring sensors and data collection points across every critical infrastructure component. This practice involves deploying monitoring capabilities on core switches, routers, firewalls, WAN links, wireless access points, and cloud connections. By ensuring there are no blind spots, you create a complete, end-to-end view of network health and data flow, which is a cornerstone of effective network monitoring best practices.

This approach is vital because a single unmonitored segment can obscure the root cause of a widespread performance issue. A problem that appears to be a server-side failure could actually originate from a saturated switch port or a misconfigured firewall rule. Hyperscalers like Microsoft exemplify this by deploying monitoring across hundreds of thousands of network points globally. Similarly, e-commerce giants like Amazon meticulously monitor all data center interconnects to guarantee the low-latency experience customers expect. This pervasive coverage ensures that no single point of failure goes unnoticed.
Actionable Implementation Tips
To achieve comprehensive monitoring without being overwhelmed, follow these structured steps:
- Prioritize and Expand: Start by instrumenting your most critical network segments, such as the data center core, primary internet egress points, and key application pathways. Once these are covered, systematically expand your monitoring footprint to less critical areas.
- Monitor All Traffic Flows: Ensure you capture both north-south (client-to-server) and east-west (server-to-server) traffic. Modern applications often generate significant internal traffic, and failing to monitor it creates a massive visibility gap.
- Integrate Cloud and On-Prem: Extend your monitoring strategy to include cloud environments (VPCs, virtual gateways) with the same rigor as your on-premises network. Use cloud-native tools and integrate their data into your central monitoring platform. For those operating in cloud-native or containerized environments, understanding specific monitoring strategies is crucial. Delve deeper into Kubernetes monitoring best practices to see how this applies at the microservices level.
- Include Redundant Systems: Do not forget to monitor your backup and disaster recovery (DR) networks. These links are critical during an outage, and you must have confidence they will perform as expected when activated.
- Use Network TAPs for Critical Links: For high-speed, mission-critical links (e.g., 40G/100G data center interconnects), consider using network Test Access Points (TAPs). TAPs provide a foolproof copy of all traffic without impacting the live network, offering a more reliable data source than SPAN/mirror ports.
4. Leverage Real-Time Network Traffic Analysis
While baselining provides a long-term view, real-time traffic analysis offers an immediate, granular understanding of what is happening on your network right now. This practice involves the continuous monitoring and deep inspection of live traffic patterns, protocols, and application behaviors. By analyzing data from sources like NetFlow, sFlow, and through Deep Packet Inspection (DPI), IT teams can instantly pinpoint performance bottlenecks, identify security threats, and find opportunities for optimization as they occur.

This level of insight is critical for modern, dynamic environments where ephemeral issues can cause significant disruption. For instance, a high-frequency trading firm relies on microsecond-level analysis to maintain a competitive edge, while a content delivery network like Cloudflare uses real-time traffic inspection to detect and mitigate DDoS attacks before they impact customers. This proactive stance moves network management from forensic analysis to immediate, actionable intelligence, which is a cornerstone of modern network monitoring best practices. You can learn more about how to leverage real-time network traffic analysis to gain a competitive advantage.
Actionable Implementation Tips
To effectively integrate real-time analysis into your operations, consider these targeted steps:
- Focus on Choke Points: Deploy traffic analysis tools at critical network junctures where congestion is most likely to occur, such as firewall interfaces, core switch uplinks, and WAN edge routers. This provides the most value for your monitoring investment.
- Utilize Traffic Sampling: On high-volume links (e.g., 10Gbps and above), full packet capture can be resource-intensive. Use intelligent sampling (like 1 out of every 1,000 packets) to get a representative view of traffic without overwhelming your analysis tools.
- Deploy Collectors Strategically: Place flow collectors and packet analyzers as close to the data sources as possible. This minimizes the monitoring traffic that has to traverse the network, reducing overhead and improving the accuracy of timing metrics.
- Create Role-Based Dashboards: Not everyone needs the same view. Develop custom dashboards for different stakeholders: a high-level application performance view for business leaders, a security-focused dashboard for the SOC, and a deep-dive packet view for network engineers.
- Keep Rules and Signatures Updated: Traffic patterns and security threats evolve constantly. Regularly update your analysis tool’s application signatures, protocol definitions, and threat intelligence feeds to ensure you are identifying new and emerging traffic types correctly.
5. Establish Centralized Logging and Data Correlation
A modern network generates a torrential downpour of data from disparate sources: routers, firewalls, servers, applications, and security appliances. Attempting to troubleshoot or investigate security incidents by manually sifting through isolated logs on individual devices is inefficient and ineffective. Centralized logging consolidates this data into a single, searchable repository, providing a unified plane of glass for all network-related events.
This practice is a cornerstone of effective network monitoring best practices because it enables powerful event correlation. By bringing diverse logs together, you can connect a firewall alert, a server error log, and an unusual traffic spike, revealing the full story of an event that would otherwise appear as unrelated noise. For instance, a government agency might use a Security Information and Event Management (SIEM) platform to correlate login attempts from a restricted IP with internal file access anomalies, while a healthcare organization relies on centralized logging to create an immutable audit trail for HIPAA compliance.
Actionable Implementation Tips
To effectively centralize and correlate your network data, follow these structured steps:
- Standardize Log Formats: Where possible, configure devices and applications to use a standardized format like Syslog or JSON. This drastically simplifies parsing, indexing, and searching within your log management platform.
- Implement Log Rotation and Archiving: Define clear policies for how long logs are kept in “hot” (quickly searchable) storage versus “cold” (archived) storage. This manages costs and ensures you meet regulatory retention requirements without overwhelming your primary system.
- Use Log Aggregation Tools: To minimize bandwidth impact, especially across WAN links, deploy log forwarders or aggregators at remote sites. These tools can compress and batch log data before sending it to the central repository.
- Create Automated Correlation Rules: Don’t wait to manually search for issues. Build automated rules in your platform (like the ELK Stack or Splunk) to flag common problems, such as multiple failed login attempts followed by a successful one from an unusual location.
- Regularly Prune and Review Sources: Periodically review the devices and applications sending logs. Decommissioned servers or overly “chatty” applications can create noise and drive up costs. Ensure you are only collecting meaningful, actionable data.
6. Implement Automated Response and Remediation
Beyond simply detecting issues, one of the most impactful network monitoring best practices is to build a system that can fix them automatically. Automated remediation uses predefined workflows to execute corrective actions when specific alerts are triggered. This moves your operations from a reactive “break-fix” model to a proactive, self-healing one, drastically reducing Mean Time to Resolution (MTTR) and freeing up valuable engineering resources from repetitive, manual tasks.
This practice is crucial for maintaining service uptime and performance in complex, dynamic environments. It minimizes the impact of outages by taking immediate action, often before a human operator is even aware of the problem. For example, a major cloud provider like AWS uses automated failover to seamlessly shift traffic away from a failing instance, while telecommunications companies leverage platforms like Ansible to automatically reroute traffic during a fiber cut, ensuring service continuity.
Actionable Implementation Tips
To effectively integrate automation without introducing unnecessary risk, follow these structured steps:
- Start with Low-Risk, High-Value Tasks: Begin by automating simple, well-understood responses. Good candidates include restarting a non-critical application service, clearing a full cache, or blocking a known malicious IP address at the firewall. This builds confidence in your automation framework.
- Implement a Manual Override: Always engineer a “kill switch” or manual override for any automated workflow. This is a non-negotiable safety measure that allows an operator to instantly halt an automated process if it behaves unexpectedly or if the situation requires nuanced human judgment.
- Thoroughly Test in a Lab Environment: Never deploy a new automation rule directly into production. Use a sandboxed lab environment that mirrors your production network to rigorously test all possible scenarios, including edge cases and potential failure modes of the automation itself.
- Maintain Comprehensive Logging: Every action taken by your automation system must be logged in detail. The logs should capture what triggered the action, what action was taken, the timestamp, and the outcome. This is essential for auditing, troubleshooting, and continuous improvement. For more on this, you can learn more about the role of network automation and AIOps in SD-WAN solutions on mushroomnetworks.com.
7. Regular Performance Reporting and Trend Analysis
Raw monitoring data is fleeting; true insight comes from transforming that data into historical intelligence. This is where systematic performance reporting and trend analysis become indispensable. This practice involves the regular, automated generation of reports that visualize network performance over time. It allows you to move beyond immediate fire-fighting to identify long-term patterns, spot gradual performance degradation, and make informed decisions about future capacity needs. Without this historical context, you’re only seeing a single frame of a much larger movie.
This process is critical for strategic IT management. It provides tangible evidence to justify budget requests, demonstrates the value of IT to business stakeholders, and ensures compliance with regulatory requirements. For example, large corporations create quarterly network capacity planning reports to forecast when WAN links will need upgrading. Similarly, an internet service provider generates monthly performance reports for enterprise customers to prove they are meeting guaranteed Service Level Agreements (SLAs), building trust and ensuring accountability. This practice is a cornerstone of mature network monitoring best practices.
Actionable Implementation Tips
To effectively implement this practice, consider these structured steps:
- Focus on Audience-Specific Metrics: Create different report templates for different stakeholders. Your network engineering team needs granular data on packet loss and interface errors, while the CIO needs a high-level dashboard showing uptime, application performance, and alignment with business goals.
- Embrace Visual Representations: A wall of numbers is intimidating and often ignored. Use charts and graphs to represent complex data. Line graphs are excellent for showing trends over time, while pie charts can illustrate bandwidth consumption by application.
- Automate Generation and Distribution: Manually creating reports is a time-consuming and error-prone task. Configure your NMS to automatically generate and email these reports on a set schedule (daily, weekly, monthly) to the relevant distribution lists.
- Connect Metrics to Business Impact: Don’t just report that latency on the WAN link increased by 15%. Report that the increased latency is slowing down the ERP system, potentially impacting sales order processing by an estimated X minutes per transaction. This frames technical data in a business context.
- Review and Refine Regularly: Reports should not be static. Hold periodic reviews with stakeholders to gather feedback. Are the metrics still relevant? Is the format clear? This iterative process ensures your reporting remains valuable and aligned with evolving business needs.
8. Maintain Comprehensive Network Documentation and Asset Management
Effective network monitoring is impossible without a clear, accurate, and accessible record of what you are monitoring. Comprehensive documentation and asset management serve as the authoritative blueprint for your entire network infrastructure. This practice involves maintaining detailed, up-to-date records of network topology, device configurations, IP address schemes, and all network changes. Without this, troubleshooting becomes an archaeological dig rather than a systematic process.
This discipline is critical because it directly impacts the speed and accuracy of incident response and strategic planning. When an alert fires, engineers need immediate access to network diagrams, device credentials, and configuration histories to diagnose the issue. Companies like NetBox and Device42 have built their businesses on this very principle. For instance, a telecommunications provider relies on meticulous fiber plant documentation to quickly locate and repair physical link failures, while a cloud provider like Microsoft Azure maintains vast network asset databases to manage its global infrastructure efficiently. Accurate documentation is a cornerstone of operational maturity and one of the most vital network monitoring best practices.
Actionable Implementation Tips
To transform documentation from a chore into a strategic asset, implement these steps:
- Automate Discovery and Mapping: Manual documentation is a losing battle. Use automated discovery tools to continuously scan your network and maintain dynamic topology maps. This ensures your diagrams reflect the reality of your infrastructure, not its last-known state.
- Integrate with Change Management: Every network change, no matter how small, must trigger a documentation update. Enforce a strict policy where change requests are not considered complete until the corresponding documentation, from diagrams to configuration backups, is updated.
- Conduct Regular Audits: Schedule quarterly or biannual audits to validate documentation accuracy against the live network state. This process helps identify discrepancies, unauthorized changes, and “shadow IT” devices that have been added to the network without approval. For MPLS environments, detailed documentation is especially critical for managing traffic and security, which you can learn more about here.
- Use a Centralized Platform: Avoid scattered Visio files and spreadsheets. Implement a centralized, collaborative platform (a “single source of truth”) for network documentation. This ensures all team members access the same, up-to-date information. To further enhance your operational efficiency, explore additional tips on general documentation best practices that can be applied across IT.
- Document Both Logical and Physical Layers: Create and maintain both logical diagrams (showing data flow, IP subnets, and VLANs) and physical diagrams (showing rack elevations, port connections, and cable runs). Both are essential for comprehensive troubleshooting.
Network Monitoring Best Practices Comparison
| Item | Implementation Complexity | Resource Requirements | Expected Outcomes | Ideal Use Cases | Key Advantages |
|---|---|---|---|---|---|
| Establish a Comprehensive Network Baseline | High initial effort, ongoing updates needed | Significant data storage and collection tools | Accurate anomaly detection, capacity planning | Complex, large-scale networks | Enables troubleshooting, SLA compliance, trend spotting |
| Implement Proactive Alerting and Threshold Management | Complex setup and tuning | Moderate (automation, ML tools) | Early issue detection, reduced MTTR | Environments needing rapid incident response | Reduces alert fatigue, improves reliability |
| Deploy Network Monitoring Across All Critical Points | High due to extensive coverage | High investment in sensors and infrastructure | Complete visibility, no blind spots | Enterprises requiring full network transparency | Precise problem localization, compliance support |
| Leverage Real-Time Network Traffic Analysis | High computational and skill demand | High CPU, storage, and expert analysis | Immediate threat detection and optimization | Security-sensitive and performance-critical networks | Detailed insights, faster response |
| Establish Centralized Logging and Data Correlation | Complex initial integration | High storage and processing capacity | Unified view for analysis and faster troubleshooting | Security and compliance-focused organizations | Enhanced incident response, audit readiness |
| Implement Automated Response and Remediation | Very complex initial setup | Integration with orchestration platforms | Reduced MTTR, minimized human error | Networks prioritizing uptime and automation | 24/7 self-healing, cost reduction |
| Regular Performance Reporting and Trend Analysis | Moderate setup, regular maintenance | Reporting tools and data analytics | Proactive planning, trend identification | Organizations focused on capacity and SLA management | Informed decision-making, improved communication |
| Maintain Comprehensive Network Documentation and Asset Management | High ongoing maintenance effort | Discovery tools and collaboration platforms | Faster troubleshooting, compliance facilitation | Dynamic environments needing accurate network data | Reduces errors, supports audits and planning |
Transforming Monitoring into a Strategic Advantage
Adopting a robust network monitoring strategy is no longer a discretionary IT function; it’s a foundational pillar for organizational resilience, performance, and growth. Moving beyond a simple break-fix mentality requires a deliberate and structured approach. The best practices detailed throughout this guide, from establishing a comprehensive network baseline to maintaining meticulous documentation, are not isolated tasks. They are interconnected disciplines that, when integrated, transform your network operations from a reactive cost center into a proactive, strategic powerhouse.
The journey begins with visibility. You cannot manage, secure, or optimize what you cannot see. By establishing a detailed performance baseline and deploying monitoring across all critical points, you create a source of truth for your network’s health. This foundation makes every subsequent action more effective, whether it’s configuring proactive alerts that catch anomalies before they escalate into outages or leveraging real-time traffic analysis to pinpoint a bottleneck impacting a mission-critical application.
From Data Points to Business Intelligence
The true value of these network monitoring best practices emerges when you connect the dots. Centralized logging and data correlation allow you to move from isolated alerts to understanding complex event chains. For instance, a sudden spike in latency on a specific switch port, correlated with unusual traffic patterns from a user device and a failed application login, instantly provides a richer context than any single data point could offer. This level of insight is crucial for rapid, accurate troubleshooting.
Furthermore, integrating automation and regular trend analysis elevates your team’s capabilities.
- Automated Remediation: Frees up skilled engineers from repetitive tasks like restarting services or clearing caches, allowing them to focus on high-value strategic initiatives.
- Performance Reporting: Translates raw metrics into actionable business intelligence, demonstrating the ROI of infrastructure investments and justifying future needs to leadership.
Ultimately, a well-monitored network is a well-managed one. It is more secure because unusual activity is flagged immediately. It is more reliable because potential failures are predicted and prevented. It is higher performing because resources are allocated efficiently based on real-world usage data, not guesswork. This disciplined approach ensures that your network infrastructure doesn’t just support business operations; it actively drives them forward by enabling innovation and ensuring a seamless user experience.
The path to mastering network monitoring is an iterative one. Start by assessing your current capabilities against these benchmarks. Pick one or two areas for immediate improvement, such as refining your alert thresholds or implementing a centralized logging tool. By consistently applying and expanding upon these principles, you build a resilient, agile, and high-performing network that serves as a true competitive advantage.
Ready to build a network that’s as resilient as it is intelligent? The principles of network monitoring are amplified when applied to an SD-WAN environment, and Mushroom Networks Inc. provides cutting-edge solutions to bond multiple internet connections for ultimate reliability and performance. Discover how our Broadband Bonding™ technology can ensure your meticulously monitored network never goes down by visiting Mushroom Networks Inc. today.