When we talk about network performance monitoring tools, we’re referring to specialized software that gives IT teams the power to see exactly what’s happening on their network. These tools go far beyond a simple up/down check. They collect, analyze, and report on crucial network metrics, ensuring everything runs smoothly to support the business’s goals. By tracking key performance indicators like latency, packet loss, and bandwidth, they empower IT professionals to get ahead of problems before they ever affect users.
Why Network Performance Monitoring Is Non-Negotiable
In a world where business operations are woven into the digital fabric, network performance isn’t just an IT concern—it’s a direct pulse on the health of your entire company. The days of just making sure a server was “on” are long gone. Today’s networks are sprawling, complex ecosystems, stretching from on-premise data centers out to multi-cloud setups and countless remote endpoints. This very complexity has turned robust monitoring from a nice-to-have into a mission-critical function for any serious IT team.
Simply knowing a device is online isn’t enough anymore. What you really need to understand is the quality of that connection. Is it fast enough? Is it stable? Can it handle the demands of real-time applications like video conferences and VoIP calls without a hiccup? These are the tough questions that modern network performance monitoring tools are built to answer.
Moving Beyond Simple Pings
Think of your network like a high-performance engine. A basic check might tell you if the engine is running, but it won’t flag a misfiring cylinder or poor fuel efficiency that’s slowly degrading performance. That’s what old-school monitoring did—it just told you if the engine was on or off.
Effective network performance monitoring, on the other hand, provides the detailed telemetry needed to not just diagnose catastrophic failures but to fine-tune that engine for peak output. It fundamentally shifts network management from a reactive, break-fix model to a proactive, optimization-focused discipline.
This change in mindset is absolutely crucial for a few key reasons:
- Guaranteeing Business Continuity: It stops minor network hiccups from snowballing into major outages that bring your operations to a grinding halt.
- Safeguarding User Experience: It ensures applications are snappy and reliable for both customers and employees, which has a direct impact on satisfaction and productivity.
- Driving Digital Initiatives: It lays down the stable, high-performing foundation required for successful cloud migrations, IoT deployments, and other tech-forward projects.
To truly understand what these tools bring to the table, it’s helpful to break down their primary functions. Modern NPM isn’t about one single task; it’s about a combination of capabilities that provide a complete picture of network health.
Core Functions of Modern Network Performance Monitoring
| Function | Core Purpose for IT Teams |
|---|---|
| Real-Time Data Collection | Continuously gathers performance data (latency, jitter, etc.) from across the network. |
| Performance Baselining | Establishes a “normal” performance benchmark to quickly spot deviations and anomalies. |
| Proactive Alerting | Sets intelligent thresholds to notify teams of potential issues before they become critical. |
| Root Cause Analysis | Provides deep diagnostic data to help pinpoint the exact source of a problem quickly. |
| Historical Reporting | Offers long-term trend analysis for capacity planning and network optimization. |
Ultimately, these functions work together to give IT teams the visibility they need to move from firefighting to strategic management, ensuring the network is an asset, not a liability.
Flying blind is simply not an option in modern IT. Without deep visibility into performance metrics, you’re essentially just waiting for something to break. Proactive monitoring delivers the hard data needed to anticipate problems and maintain a resilient, high-performing infrastructure.
The strategic value of this visibility is clearly reflected in the market’s growth. The global network monitoring market, valued at $2.84 billion, is on track to hit $4.76 billion by 2029. As highlighted in market growth insights from The Business Research Company, this expansion shows an industry-wide consensus: comprehensive monitoring is a strategic investment. At the end of the day, putting money into these tools is an investment in stability, predictability, and business continuity.
Decoding the Metrics That Truly Matter
Effective network analysis isn’t about drowning in data; it’s about understanding the core metrics that actually tell a story. Network performance monitoring tools can throw a dizzying amount of information at you, but only a few key measurements are the true bedrock of actionable intelligence. It’s not enough to know the dictionary definition of a metric. A seasoned IT pro has to grasp how each one tangibly impacts the applications that keep the business running.
This understanding is what separates seeing raw numbers on a dashboard from making smart, proactive decisions that prevent downtime and keep users happy. You’re essentially translating data into a narrative about your network’s health, moving from a reactive “firefighting” mode to one of proactive performance tuning.
Latency: The Silent Application Killer
Latency, often just called delay, is the time it takes for a data packet to get from point A to point B. It’s measured in milliseconds (ms), and even a small increase can feel like an eternity to your applications. Think of it as that awkward pause in a phone call that makes the conversation feel stilted and out of sync.
Let’s say a database administrator notices that complex queries are taking longer and longer to run, bogging down a critical financial app. The servers and database seem fine. A quick look with a network monitoring tool, however, might reveal a subtle creep in latency over the WAN link. While the delay for a single packet is tiny, it’s magnified across the thousands of back-and-forth requests a single query generates. The result? A significant, frustrating slowdown for the end-user. For teams looking to get ahead of this, exploring how to reduce network latency provides direct, actionable strategies.
Latency is the tax on every single network transaction. While you can’t eliminate it completely, failing to monitor and manage it is like letting that tax rate climb unchecked, eventually grinding your application performance to a halt.
Jitter: The Enemy of Real-Time Communication
If latency is the travel time for one packet, jitter is the variation in that travel time across a stream of packets. Imagine a convoy of cars all leaving at the same time but arriving at their destination sporadically. That’s jitter. An unstable network with high jitter delivers packets out of order or with unpredictable delays.
This is absolutely devastating for real-time services. Take a company-wide video conference. High jitter is what causes video to freeze, stutter, or pixelate. It’s what makes the audio choppy and garbled. The packets carrying the audio and video are arriving so erratically that the application can’t piece them together into a smooth, coherent stream. This directly cripples collaboration and turns a vital communication tool into a source of frustration. Technologies like SIP trunking, which are the backbone of modern voice and video systems, are extremely sensitive to jitter.
Packet Loss: The Data That Never Arrives
Packet loss is exactly what it sounds like: the percentage of data packets that get lost in transit and never reach their destination. It’s like sending a 100-page document in the mail, but five random pages simply vanish. The recipient can’t make sense of the document without those missing pieces, and neither can your network applications.
Even a seemingly small amount of packet loss, like 1%, can have a catastrophic impact. During a large file transfer, the system is forced to constantly request retransmissions of the lost packets, which can slow the entire process to a crawl or cause it to fail completely. For a VoIP call, that 1% loss can cause entire words or syllables to drop out, making a conversation completely unintelligible. This is where a good network performance monitoring tool becomes essential, as it can spot this subtle but highly destructive problem before it brings your critical services down.
Essential Features of a Modern NPM Solution
Trying to pick the right network performance monitoring tool can feel like navigating a maze. The market is crowded, and it’s all too easy to get bogged down in a long list of features, struggling to tell what’s genuinely useful and what’s just marketing noise. To cut through it all, you need a clear picture of the core capabilities that make a solution truly modern—one that actively improves your operations instead of just adding another dashboard to your collection.
The right NPM tool shouldn’t just aggregate data; it must transform that data into actionable intelligence. The right feature set can drastically reduce your Mean Time to Resolution (MTTR) and help your team pivot from a reactive, break-fix model to a proactive, predictive one. This is a crucial move that directly impacts everything from user satisfaction to the company’s bottom line.
Just look at the tangible business outcomes that a solid NPM strategy delivers.
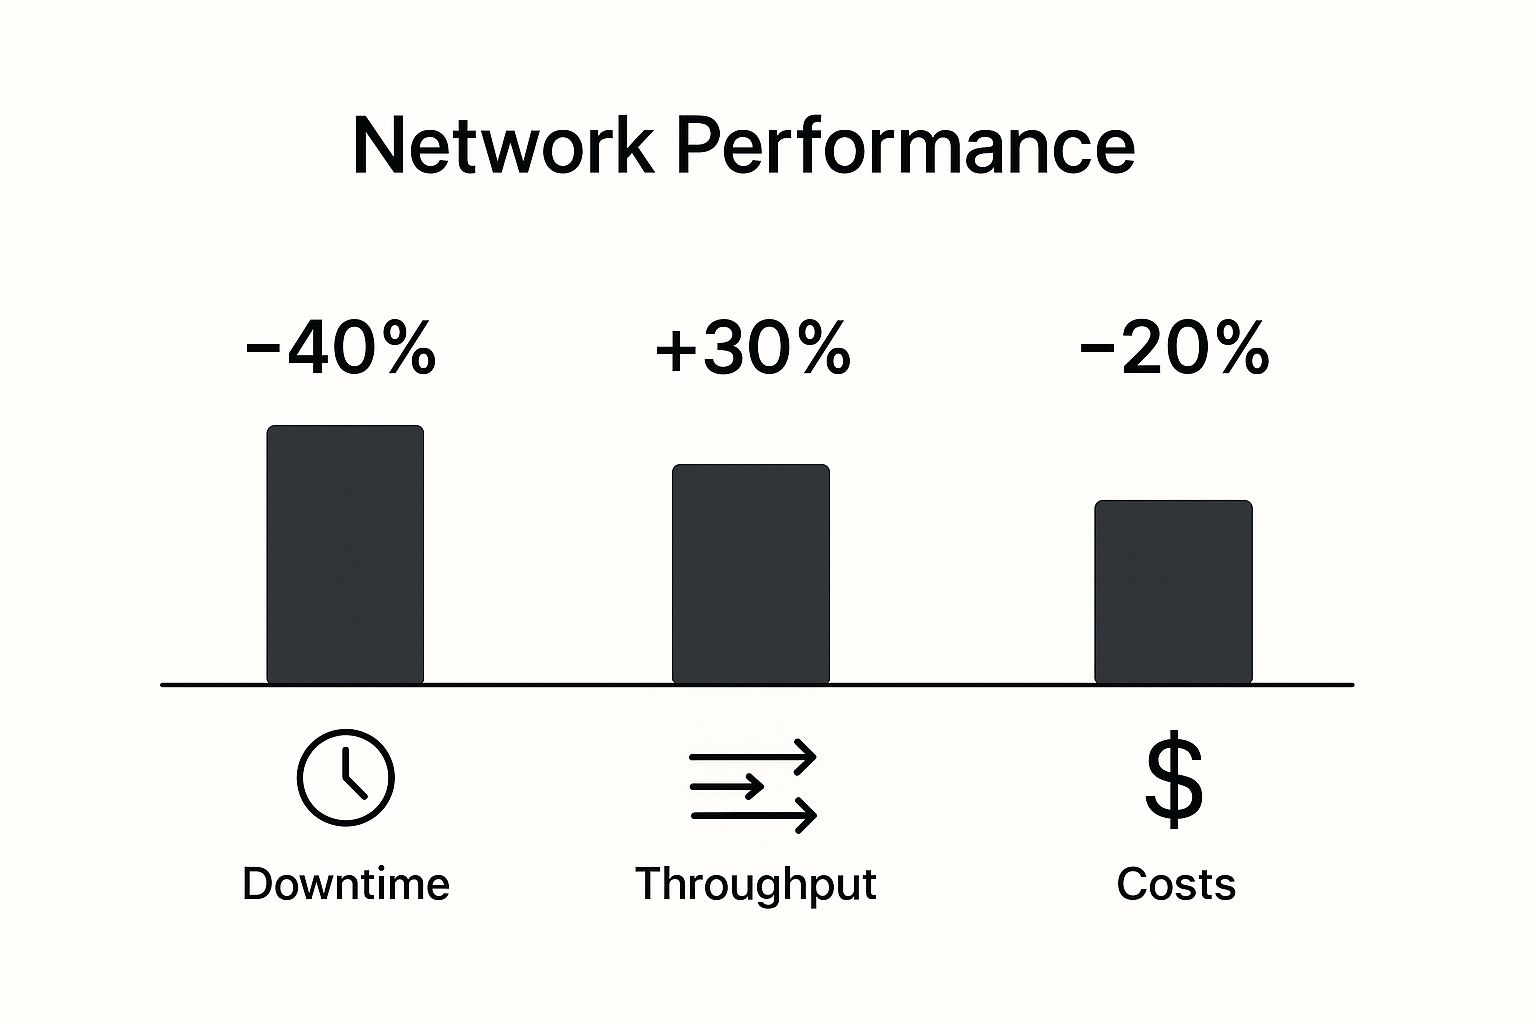
The data speaks for itself. Investing in the right tools can bring about massive operational wins, including a 40% reduction in network downtime and a 20% drop in operating costs.
Foundational Monitoring Capabilities
Before you even think about the flashy, advanced stuff, you have to make sure any tool you consider has mastered the basics. These foundational features are the non-negotiable building blocks for effective network visibility.
Real-Time, Granular Monitoring: Forget about simple five-minute polling intervals. To catch those frustrating, intermittent issues that cause random slowdowns, you need data collection in real time (we’re talking sub-minute). It also needs to be granular enough to let you zoom in on specific interfaces, applications, or timeframes.
Intelligent and Contextual Alerting: Alert fatigue is a real killer for IT teams, causing critical notifications to get lost in the noise. A modern system uses dynamic baselining to learn what “normal” looks like for your network, only firing off alerts for true anomalies. These alerts should also be packed with context, giving your team diagnostic data that points them straight toward the root cause.
Customizable, Role-Based Dashboards: Your network admin, your security analyst, and your CIO all care about different things. A tool must allow you to create custom, role-specific dashboards to get the right information to the right people without all the clutter. This ensures everyone, from the NOC technician to the C-suite executive, gets a clear, relevant view of performance.
Differentiating Advanced Features
While getting the basics right is crucial, the advanced features are what really separate a good tool from a great one. These are the capabilities that provide the deep insights needed to manage today’s complex, hybrid network environments.
A modern NPM solution must provide a single, unified view of performance, which is essential for troubleshooting issues in a hybrid architecture where the problem could be anywhere—from the on-premise data center to a public cloud provider.
Achieving that kind of end-to-end visibility depends on more sophisticated features that go beyond the fundamentals. Not all NPM tools are created equal, and understanding the difference between baseline capabilities and true differentiators is key to making a smart investment.
Essential vs. Advanced NPM Feature Comparison
The table below breaks down the standard features you should expect versus the advanced capabilities that signify a more mature, forward-thinking NPM platform. This can help you gauge where a potential tool sits on the innovation spectrum.
| Feature Category | Essential Capability (The Baseline) | Advanced Capability (The Differentiator) |
|---|---|---|
| Alerting System | Static, manually set thresholds for alerts. | Dynamic baselining that learns network behavior and AI-driven anomaly detection. |
| Data Visibility | Basic SNMP polling for device health and interface stats. | Deep packet inspection and flow analysis (NetFlow, sFlow, IPFIX) for traffic visibility. |
| Root Cause Analysis | Manual data correlation across multiple dashboards. | Automated root cause analysis that correlates events across layers to pinpoint the source. |
| Future Planning | Historical reporting for retroactive analysis. | Predictive analytics and forecasting using AI/ML to predict future bottlenecks. |
| Architecture Scope | Primarily focused on on-premise infrastructure monitoring. | Unified visibility across on-prem, multi-cloud, and hybrid environments. |
This comparison highlights the evolution of network monitoring. While the “Essential” column covers the table stakes, the “Advanced” column is where you’ll find the features that empower proactive management and solve the complex problems of modern IT.
Deep Traffic and Flow Analysis
Knowing how much bandwidth is being used is one thing; knowing what is using it is another game entirely. This is where support for flow protocols becomes a must-have.
- NetFlow/sFlow/IPFIX: These protocols give you incredible detail about traffic patterns. You can see top talkers, identify specific application conversations, and track traffic destinations. This is indispensable for hunting down bandwidth hogs, spotting unauthorized apps, and even aiding in security forensics.
AI-Powered Predictive Analytics
The next frontier in network monitoring is shifting from detecting current problems to predicting future ones. This is where AI and machine learning really shine. An AI engine can analyze historical trends and subtle performance shifts to forecast potential capacity bottlenecks or component failures before they affect service. This capability is a game-changer, transforming network management from a reactive chore into a proactive strategy.
This growing focus on advanced, real-time analytics is a primary driver of the market’s expansion. The global Network Performance Monitoring (NPM) market is projected to grow from $3.9 billion to around $6.2 billion by 2032. As this forecast details, this steady growth shows the increasing enterprise demand for tools that deliver deep, predictive insights into network health. You can read the full research on the NPM market from MarketResearch.com to learn more.
How to Select the Right NPM Tool
Choosing from the sea of network performance monitoring tools isn’t a minor task; it’s a high-stakes decision with long-term consequences for your budget and your team’s sanity. You have to move beyond a simple feature checklist. A strategic framework is what you really need to navigate the selection process with confidence, ensuring the tool you pick truly fits your technical and business realities.
It’s about evaluating the critical factors—scalability, deployment models, and the total cost of ownership (TCO). A tool that looks amazing on paper might buckle under the real-world pressure of your network’s unique demands. The goal here is to make an informed, defensible decision that will serve your team well for years to come.
Defining Your Core Operational Needs
Before you even glance at a vendor’s website, you need to get crystal clear on what you need the tool to accomplish. Every network has its own personality, and a solution that’s perfect for a small business will be completely overwhelmed by a global enterprise.
Start by asking some pointed questions about your own environment:
- What is your architectural reality? Are you wrestling with a legacy on-premise data center, a sprawling multi-cloud architecture, or a hybrid model that’s a bit of both? The tool must have native visibility into every corner where your applications and infrastructure live.
- What are your primary use cases? Is your main focus on guaranteeing flawless SD-WAN performance? Or perhaps supporting a large, distributed remote workforce? Maybe it’s all about monitoring latency-sensitive applications in real time. Your top priorities should dictate the features you can’t live without.
This initial soul-searching forms the very foundation of your selection criteria. Don’t skip it.
Evaluating Scalability and Total Cost of Ownership
Scalability isn’t just about handling your current device count; it’s about whether the tool can grow with you without the performance falling off a cliff or the costs spiraling out of control. A tool’s licensing model plays a massive role here. Is it priced per sensor, per device, per agent, or based on data volume? You have to understand how these costs will scale as you inevitably add more network segments, cloud instances, or remote sites.
Beyond the upfront license fee, you must calculate the Total Cost of Ownership (TCO).
TCO gives you a much more realistic financial picture than the sticker price alone. It forces you to account for the often-hidden costs of implementation, training, necessary hardware for on-premise deployments, and ongoing maintenance. A “cheaper” tool with a sky-high TCO is no bargain at all.
This calculation also forces you to weigh deployment models. A SaaS solution might offer lower upfront costs and easier maintenance, while an on-premise deployment gives you greater control over your data but demands more internal resources to manage and maintain. There’s always a trade-off.
The Litmus Test: A Rigorous Proof of Concept
Finally, never, ever purchase a network performance monitoring tool without running a rigorous Proof of Concept (PoC) in your own live environment. Marketing promises and polished, canned demos are one thing; how it performs under the messy reality of your network is another thing entirely.
A PoC is your chance to put a vendor’s claims to the test. Can it actually handle your traffic volumes? Are the alerts intelligent and genuinely actionable, or are they just a source of constant noise? Does the dashboard provide the at-a-glance clarity your team desperately needs?
Involving your team in this phase is absolutely critical for getting buy-in and, just as importantly, for sniffing out any usability problems. A thorough PoC is the single best way to validate that a tool not only meets your technical requirements but also fits your team’s workflow. This is especially important when you think about how the tool will integrate with other key systems, a consideration similar to when you determine which type of network load balancer is right for you.
Best Practices for NPM Implementation
Picking out a powerful network performance monitoring tool is really just the first step on the journey. The real value from that investment gets unlocked when you implement and operationalize it correctly. A poorly executed rollout can turn a promising solution into just another noisy dashboard that everyone ignores. A strategic deployment, on the other hand, transforms it into an active partner that helps maintain peak network performance.
The goal here is to get beyond just passively watching metrics and create an intelligent feedback loop for your IT operations. This takes a thoughtful approach, blending the technical setup with a sharp focus on your team’s actual day-to-day workflows. It’s all about turning raw data into actionable intelligence that drives real improvements.
Establish Your Network Performance Baseline
Before you can spot anything unusual, you have to know what “normal” looks like for your network. This is the crucial process of baselining. You’ll use your new NPM tool to capture performance data over a set period—usually a few weeks is enough—to get a clear picture of your network’s typical behavior.
This baseline becomes your ground truth. It tells you your average latency during business hours, what typical bandwidth usage looks like on a Tuesday afternoon, and your normal packet loss rates. Without this reference point, every alert is just a shot in the dark.
A baseline transforms your monitoring from a system of arbitrary, static thresholds to one based on the unique, dynamic personality of your own network. It’s the foundation for intelligent alerting and accurate anomaly detection.
Implement a Phased and Strategic Rollout
Trying to monitor every last device, interface, and application from day one is a surefire way to overwhelm your team. A much smarter approach is a phased rollout. Start with your most critical infrastructure and applications—the ones that would cause the most pain if they went down.
This strategy pays off in several ways:
- Quick Wins: It lets your team score early successes by stabilizing high-value services. This demonstrates the tool’s ROI almost immediately.
- Fine-Tuning: It gives you a controlled environment to fine-tune alert thresholds and dashboard setups before you expand across the entire network.
- Reduced Overwhelm: It prevents that initial flood of data and alerts that can lead to confusion and frustration while everyone is still on the learning curve.
Set Intelligent Alerts to Combat Fatigue
Alert fatigue is a real and serious problem. It’s what happens when IT teams get so bombarded with notifications that they become desensitized, potentially causing them to ignore a genuinely critical issue. The key to avoiding this is to make every single alert meaningful.
This is where your baseline really shines. Use it to configure dynamic thresholds. An alert shouldn’t fire just because a metric crosses some generic number; it should fire when it deviates significantly from its established normal behavior. For instance, instead of an alert for “CPU over 80%,” create one for “CPU is 40% higher than its normal baseline for this time of day.” This context-aware approach cuts down the noise dramatically and ensures that when your team gets an alert, they know it matters. Similar strategies are essential in related fields; you can explore our guide on the best practices for SD-WAN to see how these principles apply there as well.
Focus on the Human Element
At the end of the day, the most advanced NPM tool is useless if your team doesn’t know how to use it effectively. Training needs to go beyond a simple tutorial on how to click around the interface. You have to train your team to think with the tool.
Integrate the NPM data directly into your core operational workflows. When an incident occurs, the NPM dashboard should be the first place the team looks to begin root cause analysis. For capacity planning meetings, its historical trend reports should be the primary data source for making decisions about future investments. By embedding the tool into these daily processes, you ensure it becomes an indispensable part of your team’s problem-solving toolkit.
Integrating NPM with Your SD-WAN Strategy

Deploying a Software-Defined Wide Area Network (SD-WAN) without deep network visibility is like putting a race car engine in a vehicle with bald tires. You’ve got all this new power, but no real way to control it or get the feedback needed to use it properly. This is why network performance monitoring isn’t just a nice-to-have; it’s a fundamental piece of any successful SD-WAN deployment.
The whole point of SD-WAN is its capacity to make smart, on-the-fly decisions about routing application traffic. But that intelligence is only as good as the data it’s fed. A strong NPM framework provides the critical visibility into the underlying network transport—the actual ISP links—that the SD-WAN controller needs to make those clever choices.
Powering Intelligent Path Selection
Let’s imagine your SD-WAN is managing two internet connections: a primary fiber line and a secondary broadband cable link. Without detailed performance data, the SD-WAN controller might only see that both links are “up.” It has no clue that the fiber line is suddenly bogged down with high latency while the cable link is running perfectly clear.
This is where the synergy with network performance monitoring tools becomes so powerful. A solid NPM system is constantly measuring the latency, jitter, and packet loss on both of those ISP circuits. It then feeds this real-time telemetry directly to the SD-WAN controller.
An SD-WAN controller that is “NPM-aware” can instantly detect that the primary fiber link’s quality has degraded. It can then automatically and seamlessly steer latency-sensitive traffic, like a VoIP call or video conference, over to the better-performing cable link without any user impact.
This level of insight elevates an SD-WAN from being a simple policy-based router to a truly dynamic, application-aware fabric. It ensures that traffic isn’t just sent over any available path, but over the best available path at that precise moment.
The Mushroom Networks Approach to Integrated Intelligence
Advanced SD-WAN solutions, like those from Mushroom Networks, don’t treat monitoring as an afterthought. For us, this deep visibility is woven directly into the core architecture. This built-in intelligence provides several crucial advantages for technical teams managing complex enterprise networks.
- Proactive Traffic Steering: The system doesn’t wait for a complete link failure. It identifies the subtle performance degradations that often precede an outage and proactively reroutes critical application traffic to maintain a perfect user experience.
- Application-Specific Routing: By understanding both the real-time state of the transport links and the specific needs of different applications, it can make highly granular decisions. For example, it will ensure a high-bandwidth file transfer doesn’t trample on a mission-critical VoIP call.
- Simplified Troubleshooting: When performance problems pop up, the integrated monitoring data provides a single source of truth. IT teams can quickly see if the issue is with a specific application, an underperforming ISP, or a misconfiguration, drastically cutting down the time to find the root cause.
This tight integration between NPM and SD-WAN creates a network that is more resilient, high-performing, and self-healing. It goes far beyond simple failover to deliver genuine optimization, ensuring the network can dynamically adapt to the constantly shifting demands of a modern business. This approach is fundamental for any IT professional tasked with guaranteeing superior application performance and reliability across the enterprise.
Frequently Asked Questions About NPM Tools
Even for the most seasoned IT pros, the world of network performance monitoring tools can spark a few questions. As networks get more complex, getting clear on what these tools do—and just as importantly, what they don’t do—is critical for making the right architectural and purchasing decisions. Here are some of the most common questions we hear.
What Is the Difference Between Network Monitoring and Network Performance Monitoring?
Think of it as the difference between a simple “on/off” light and a car’s full diagnostic dashboard.
Traditional network monitoring is all about availability—it tells you if a device is up or down. It’s the “on/off” switch. Network Performance Monitoring (NPM), on the other hand, goes much deeper. It digs into the quality of the connection and how data is actually flowing.
NPM looks at key metrics like latency, jitter, and packet loss to tell you how well the network is doing its job. It doesn’t just ask, “Is the network working?” It answers, “Is the network delivering the quality our applications and users demand?” It’s a shift from focusing on simple connectivity to focusing on experience and efficiency.
How Do AI and Machine Learning Enhance NPM Tools?
This is where NPM shifts from being a reactive tool to a proactive one. Instead of having your IT team set up static alert thresholds that often lead to a flood of false positives, an AI engine learns the unique, ever-changing baseline of your network’s normal behavior. This is a game-changer for intelligent anomaly detection, letting it flag subtle shifts that are often the first sign of a major problem.
AI-powered root cause analysis can connect the dots between thousands of data points in an instant. This slashes Mean Time to Resolution (MTTR) by pinpointing the source of a problem with incredible speed. It’s all about finding issues before your users even notice them.
This capability moves monitoring from a manual, time-intensive chore to an automated, predictive process. It helps teams get out in front of performance problems instead of constantly playing catch-up.
Can NPM Tools Monitor Performance in Cloud and Hybrid Environments?
Absolutely. In fact, this is a non-negotiable feature for any modern NPM tool. Legacy monitoring solutions were designed for the on-premise world and are often completely blind to what’s happening in the cloud.
A proper NPM solution provides true end-to-end visibility. It can trace an application’s path from your data center, across the WAN, and deep into IaaS/PaaS environments like AWS, Azure, and GCP.
This single, unified view is essential for troubleshooting in today’s hybrid architectures, where a problem could be lurking anywhere. Without that holistic perspective, IT teams are left with massive blind spots, making it almost impossible to diagnose complex performance issues that span multiple domains.
Ready to gain complete visibility and control over your network performance? Mushroom Networks delivers intelligent, self-healing SD-WAN solutions with integrated monitoring capabilities to ensure your applications always run at their best. Discover how our solutions can transform your network today.