To effectively reduce network latency, one must first perform a thorough root cause analysis. A targeted, data-driven approach is essential to pinpoint whether delay originates from propagation, transmission, processing, or queuing. Accurate diagnosis is the prerequisite for applying the correct mitigation strategy instead of relying on guesswork.
Diagnosing the Sources of Network Latency

For IT professionals, latency is a multifaceted metric that can severely degrade application performance and user experience. Optimization cannot begin until the specific component of latency causing the issue is correctly identified. A “the network is slow” ticket is operationally useless without a precise diagnosis of the underlying cause.
The process must shift from anecdotal evidence to a data-driven strategy. This begins with decomposing latency into its four fundamental types and knowing the diagnostic approach for each one.
The Four Pillars of Latency
Effective troubleshooting requires dissecting the total round-trip time into four distinct components. Each component has a unique cause and, consequently, a different solution.
Propagation Delay: This is a function of physics—the time required for a signal to traverse the physical medium (fiber, copper, or wireless). For a financial firm executing trades between New York and London, this is a non-negotiable delay dictated by the speed of light over that distance.
Transmission Delay: This is the time required to place all of a packet’s bits onto the link, determined by packet size and link bandwidth. A large data backup traversing a 100 Mbps link will have a significantly higher transmission delay than a small DNS query packet.
Processing Delay: Each network device—router, switch, firewall—requires time to inspect a packet’s header and execute forwarding logic. Legacy hardware or complex firewall rule sets can increase this delay, creating a bottleneck even on a high-bandwidth link.
Queuing Delay: This occurs when a packet must wait in a buffer because of network congestion. For a media company, this is the classic cause of buffering during a popular live stream as packets are queued for processing by a saturated router.
The initial step in resolving network latency is not deploying a solution but correctly identifying the problem. It is imperative to differentiate between a physical distance issue (propagation) and a congestion issue (queuing) to apply the appropriate fix.
From Theory to Practice
Understanding these pillars is foundational, but applying this knowledge in a real-world multi-WAN or SD-WAN environment is where effective optimization occurs. An SD-WAN solution can excel at routing traffic around a congested link (addressing queuing delay) but cannot alter the physical distance between offices (propagation delay).
A methodical diagnostic process is therefore critical. For practical guidance on investigating the root causes of network slowdowns, consult this guide on how to troubleshoot network issues fast. Once the exact source is pinpointed, a targeted plan can be developed to deliver measurable results.
You can’t fix what you can’t measure. This is a fundamental principle in IT, particularly when attempting to quantify an element as elusive as network latency. Attempting to optimize a network without a clear performance baseline is inefficient and lacks verifiable outcomes.
For any IT team, establishing this baseline is the critical first step. It facilitates the transition from vague user complaints like “the network feels slow” to objective, data-backed insights. This process transforms raw metrics into actionable intelligence, enabling you to set meaningful benchmarks against Service Level Agreements (SLAs) and make informed infrastructure decisions.
Gathering Your Core Latency Data
The foundation of a reliable baseline is consistent, accurate measurement. This is an ongoing process, not a one-time check, designed to uncover patterns like peak-hour congestion or real-world performance differentials between various WAN links.
Initial data can be gathered using fundamental command-line tools:
- ICMP Pings: A simple
pingcommand is the standard method for a quick measure of round-trip time (RTT) between two endpoints. Consistent execution helps identify immediate availability issues and provides a general sense of responsiveness. - Traceroute Analysis: When a simple ping is insufficient for understanding the entire packet journey,
traceroute(ortracert) is invaluable. It reveals each hop in the path and the latency introduced at each step, helping to isolate whether a delay is within the local network, the ISP’s domain, or closer to the destination server.
While these tools are essential for ad-hoc diagnostics, a robust monitoring strategy requires a more sophisticated approach. This is the domain of dedicated Network Performance Monitoring (NPM) platforms, such as those from SolarWinds or Paessler PRTG. These solutions automate data collection, providing a continuous, historical view of network health.
This infographic breaks down the three core metrics that must be tracked: round-trip time, jitter, and packet loss.
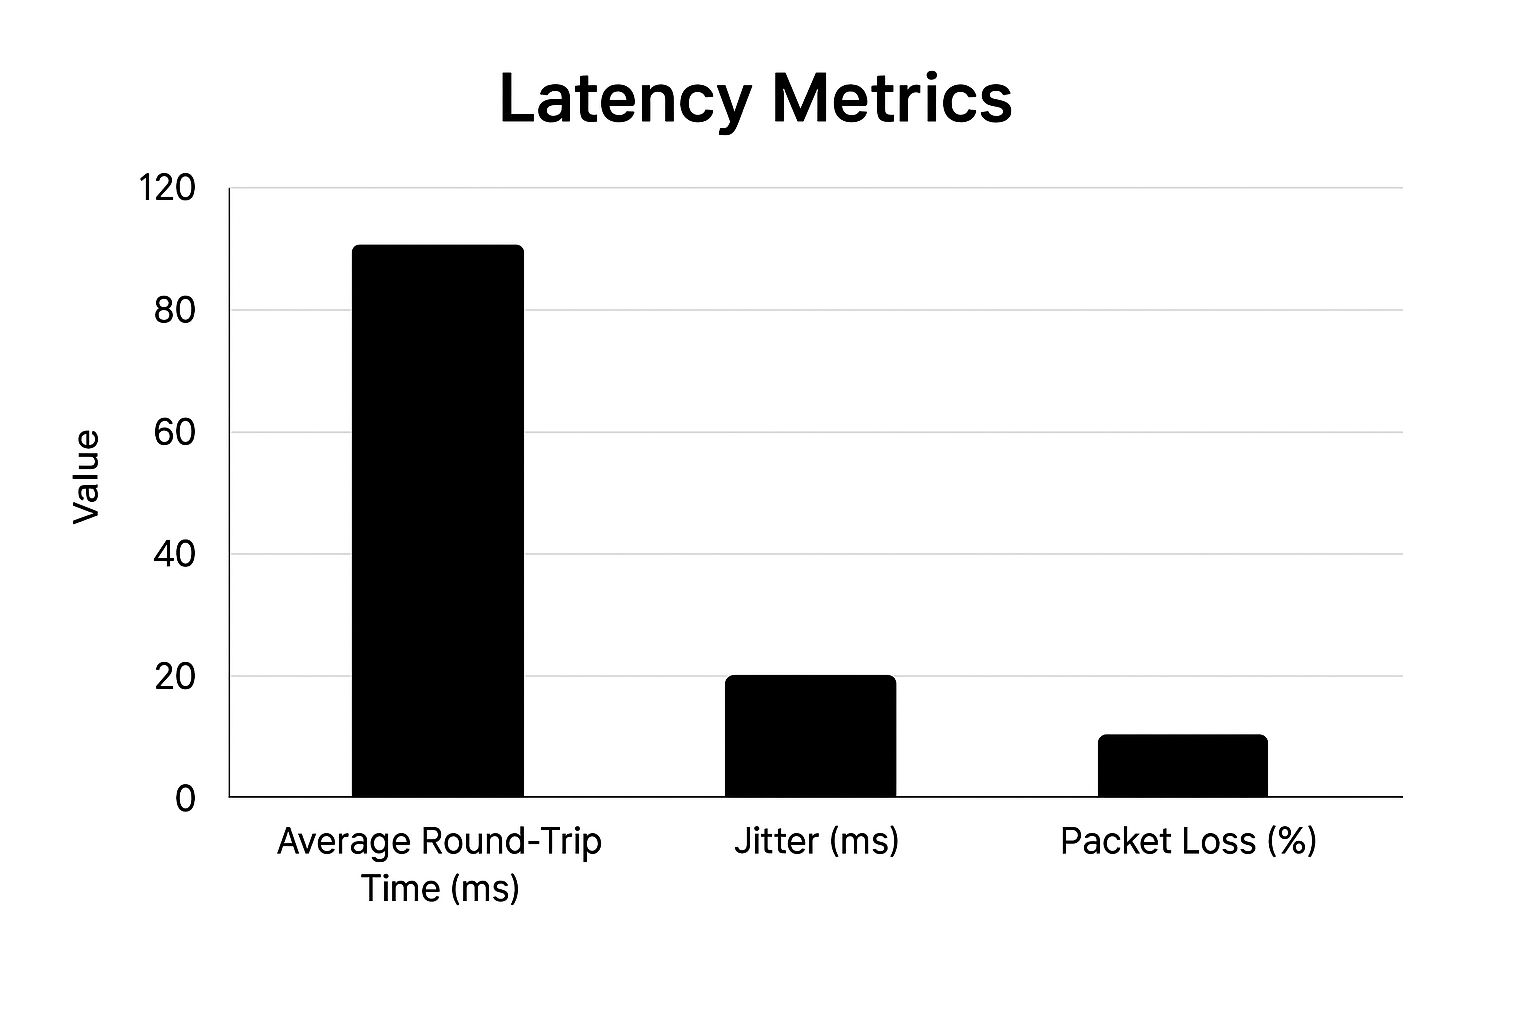
By monitoring these three key indicators in concert, you get a complete picture of network quality, not just its speed.
Latency Measurement Tools and Their Primary Use Cases
Selecting the appropriate tool is crucial for effective latency diagnosis. The following table compares common tools used by IT professionals, their measurement capabilities, and their optimal use cases. This aids in selecting the best approach for specific diagnostic needs, from quick checks to deep-dive analysis.
| Tool | Primary Use Case | Type of Latency Measured | Best For |
|---|---|---|---|
| Ping | Quick RTT measurement and basic connectivity testing. | Round-Trip Time (RTT) | Spot-checking link health and responsiveness. |
| Traceroute | Identifying the path packets take and latency at each hop. | Hop-by-hop latency and path discovery. | Pinpointing exactly where delays are occurring. |
| Iperf/Jperf | Measuring maximum network throughput and bandwidth. | Indirectly measures latency’s impact on throughput. | Bandwidth testing and stress-testing links. |
| NPM Platforms | Continuous, automated monitoring of network-wide performance. | RTT, jitter, packet loss, and more. | Long-term baseline creation and trend analysis. |
These tools, used in combination, provide a comprehensive view of your network’s performance, enabling a shift from reactive troubleshooting to proactive management.
Setting Meaningful Performance Benchmarks
Once data collection is underway, the next step is to contextualize it against industry standards. Global providers adhere to strict internal targets to ensure a high-quality user experience.
For instance, major carriers aim for intra-regional round-trip latency of 45 milliseconds or less within North America and 30 milliseconds or less within Europe. These are not aspirational goals; they are operational targets maintained through constant monitoring, often with ICMP pings conducted every five minutes from key network hubs to ensure packet delivery reliability exceeds 99.5%. You can review these carrier-grade targets on resources like the Verizon Business terms page.
A baseline isn’t just a number; it’s context. Knowing your average latency is 50ms is useful. Knowing it spikes to 200ms every day at 2:00 PM when cloud backups initiate is actionable intelligence.
This is precisely why continuous monitoring is so critical. It allows for the identification of patterns and anomalies that inform the entire strategy to reduce network latency. By establishing what “normal” looks like for your network—across different times of day and under various loads—you can rapidly detect deviations, accelerate problem diagnosis, and prove the impact of optimization efforts. This data becomes the single source of truth for all subsequent architectural and policy decisions.
Optimizing Your WAN and Cloud Architecture
With a performance baseline established, the focus shifts from measurement to active latency reduction. This phase involves strategic architectural decisions for the Wide Area Network (WAN) and cloud infrastructure, aiming to build speed and resilience into the network’s core design.
For any organization operating a multi-WAN environment, an SD-WAN solution is the primary tool for this task. It provides the intelligence layer for creating automated traffic-steering policies aligned with business priorities.
Intelligent Traffic Steering with SD-WAN
At its core, modern SD-WAN enables policy-based routing, which allows for dynamic traffic forwarding across multiple links based on real-time performance metrics. For latency-sensitive applications, this capability is transformative.
Consider a common scenario with two WAN links: a high-bandwidth but variable-performance cable connection and a lower-bandwidth but highly stable fiber line. With SD-WAN, policies can be configured to automatically route latency-sensitive traffic—such as VoIP and video conferencing—over the stable fiber link to maintain low latency and jitter.
Simultaneously, less sensitive bulk traffic, like data transfers or cloud backups, can be offloaded to the higher-capacity cable connection.
The objective is to match application requirements with the optimal-performing path available at any given moment. This dynamic approach ensures critical services receive prioritized treatment, directly improving user experience.
When tuning the network for real-time applications, it is critical to understand the essential video conferencing bandwidth requirements for them to function correctly. This knowledge informs the creation of more effective routing policies. For deeper insights, our guides on WAN optimization best practices offer additional strategies.
The Critical Role of Cloud Region Selection
Cloud architecture is an equally significant factor in the latency equation, particularly in hybrid environments. The physical distance between users, on-premises data centers, and cloud resources is often the largest contributor to propagation delay. Therefore, selecting the appropriate cloud region is paramount.
The principle is straightforward: co-locate applications and their associated data as close to the end-user population as possible. Hosting an application in a US-based cloud region for a primarily European user base introduces unnecessary transatlantic latency into every request.
Major cloud providers publish inter-region performance data. Microsoft Azure, for example, continuously measures round-trip latencies between its global data centers, collecting data every minute to calculate the median (P50) latency. This data indicates that latency between Azure regions in the same geography often remains below 50 milliseconds, whereas intercontinental connections are significantly higher. This public data can be used to make informed architectural decisions, as detailed in their findings on Azure network latency.
By leveraging this provider data, workloads can be placed strategically to minimize round-trip times. This is a fundamental step in engineering a hybrid infrastructure for speed and responsiveness, and a key tactic for reducing network latency at scale.
Applying Advanced Latency Reduction Techniques

With the core architecture optimized, the next step is to implement more granular controls. These techniques are designed to mitigate the final milliseconds of delay that differentiate an adequate network from a high-performance one. The focus shifts from basic traffic steering to intelligent controls that actively preserve data integrity and guarantee delivery.
These strategies are particularly effective in complex multi-WAN environments where link quality is unpredictable. The goal is to build a network that not only routes traffic intelligently but also anticipates and corrects for issues before they impact application performance.
Implementing Quality of Service for Traffic Prioritization
Any IT professional serious about reducing latency for critical applications must master Quality of Service (QoS). QoS is the mechanism for informing the network about traffic priority, ensuring high-importance packets receive preferential treatment. Without QoS, a large, non-urgent data backup can easily saturate a link, causing unacceptable jitter and delay for a VoIP call.
By implementing QoS policies, traffic can be classified based on application type, IP address, or other identifiers. A typical hierarchical classification includes:
- Real-Time Priority: Traffic such as VoIP and video conferencing is tagged for the highest priority and gains immediate access to bandwidth.
- Business-Critical Applications: Core business systems like ERP or CRM platforms receive the next level of priority to ensure responsiveness.
- Best-Effort Traffic: Bulk data transfers, general web browsing, and other non-urgent activities are assigned the lowest priority, utilizing remaining available bandwidth.
This hierarchical approach prevents low-priority traffic from interfering with services that depend on minimal delay, directly improving the perceived performance of critical applications.
QoS is not about creating more bandwidth; it is about intelligently allocating existing bandwidth. By ensuring mission-critical packets are not queued behind less important data, you can dramatically lower perceived latency for key services.
Counteracting Unreliable Links with SD-WAN Features
Even a well-architected network can be compromised by an unstable internet link. This is where advanced SD-WAN features like Forward Error Correction (FEC) and packet duplication become indispensable. These technologies are specifically designed to combat the effects of packet loss and high jitter, which are common on wireless (4G/5G) and consumer-grade broadband circuits.
Forward Error Correction (FEC) functions by adding redundant data to the packet stream. If a packet is lost in transit, the receiving device can use this extra data to reconstruct the missing packet locally, avoiding the need for a retransmission. This circumvents the significant latency penalty incurred while waiting for a lost packet to be resent.
Packet Duplication is a more aggressive technique. For the most critical traffic flows, an SD-WAN appliance can be configured to send identical packets simultaneously over two or more separate WAN links. The first packet to arrive at the destination is used, and the duplicate is discarded. While this consumes additional bandwidth, it provides a powerful guarantee of delivery for applications like financial trading or industrial control systems, where any loss of connectivity is unacceptable.
These packet-level strategies are a core component of mastering WAN load balancing, ensuring a combination of speed and high reliability.
Moving Processing Closer with Edge Computing
Finally, the most direct method to reduce latency is often to decrease the physical distance data must travel. Edge computing achieves this by deploying compute resources and local Points of Presence (PoPs) closer to end-users.
Instead of every request traversing the WAN back to a centralized data center or cloud region, data can be processed locally at the network “edge.” For time-sensitive services and applications, this architecture can dramatically reduce round-trip times.
Building a Proactive Maintenance and Improvement Cycle
Effectively managing network latency is not a one-time project but an ongoing operational discipline. The objective is to transition from a reactive, fire-fighting mode to a forward-looking improvement cycle that keeps the network aligned with evolving business requirements.
This begins with establishing a strict schedule for firmware and software updates on all network hardware. These updates are non-trivial, often containing critical performance enhancements and security patches that directly address issues like processing delay. Operating hardware on outdated software introduces unnecessary risk of performance degradation.
Turning Data into Future-Proofing
With a solid maintenance routine in place, the primary work involves regular, in-depth traffic analysis. It is necessary to understand not only current bandwidth utilization but also its trajectory. Are certain applications experiencing demand growth? Are new services being deployed that will introduce new network strains?
This analysis enables forecasting of future capacity requirements before they manifest as performance bottlenecks. By projecting growth, you can make data-driven decisions about when to upgrade links or adjust SD-WAN policies, ensuring sufficient headroom is always available. This is the core of any long-term strategy to reduce network latency.
High-performing IT teams do not just solve today’s problems—they proactively prevent tomorrow’s. Fostering a performance-aware culture ensures that latency is treated as a key business metric, not merely a technical issue.
Embracing a Continuous Improvement Loop
This forward-looking methodology naturally establishes a continuous improvement loop that drives sustained, long-term performance. This is not an abstract theory but a set of concrete, recurring actions.
The practical application of this loop includes:
- Dive into Performance Data: Regularly review NPM dashboards and latency metrics to identify new trends or emerging choke points that were not present in previous periods.
- Refine SD-WAN Policies: Use the gathered data to inform the fine-tuning of traffic-steering and QoS rules. As business priorities evolve, network policies must adapt accordingly.
- Scout Emerging Technologies: Monitor advancements like 5G, next-generation fiber, and LEO satellite internet. Continuously assess when these technologies could provide a tangible advantage for specific use cases. For example, as a company’s cloud footprint expands, understanding the optimal strategies for implementing a hybrid cloud becomes critical for maintaining low-latency connectivity.
By formalizing this process, the operational posture shifts from reactive to strategic control. This ensures the network not only meets current demands but is also engineered to support future growth and innovation without being constrained by latency.
Answering Your Top Questions About Network Latency
When managing network performance, several questions consistently arise. Clarifying these concepts is the first step toward making more informed architectural and operational decisions.
What Is Considered Good Network Latency?
This is a common question, and the correct answer is: it depends entirely on the application. A universal “good” latency number does not exist because different services have vastly different tolerances for delay.
For real-time applications, performance thresholds are much stricter.
- VoIP and Video Conferencing: A round-trip time under 150ms is generally considered usable. However, for a high-quality, seamless experience without conversational overlap, the target should be under 50ms.
- General Business Applications: For most other services, such as SaaS platforms or internal databases, maintaining latency below 100ms provides a responsive user experience.
The most effective approach is to benchmark your own critical applications. This is the only way to define performance thresholds that are meaningful to your business operations and meet user expectations.
Can SD-WAN Alone Solve All My Latency Problems?
While SD-WAN is a powerful tool for traffic optimization, it is not a panacea for all latency issues. It excels at intelligently routing traffic across multiple WAN links, effectively bypassing congestion and poorly performing circuits.
However, SD-WAN cannot alter the laws of physics. An SD-WAN solution will not reduce the propagation delay inherent in the physical distance between New York and London. It also cannot remediate a fundamentally faulty or under-provisioned link from an ISP.
Consider SD-WAN as the control plane of your network. It makes the most intelligent routing decisions possible given the available transport resources, but it cannot create better resources.
SD-WAN is most effective when implemented as the centerpiece of a comprehensive strategy that includes intelligent infrastructure design, proactive carrier management, and application-level tuning to build a truly high-performance network.
How Do I Differentiate Between Network and Application Latency?
This is a critical distinction in troubleshooting that can save significant time and effort. The methodology involves isolating the two components.
Begin by using network-level tools to measure the RTT for packets traveling from a user’s machine to the application server and back. This measurement quantifies the network’s contribution to the total delay.
If that RTT is low—for example, 40ms—but the application still exhibits a multi-second delay after a user action, the bottleneck is almost certainly on the server side. This is application latency: the time the server requires to process the request and generate a response. The ability to differentiate between these two is a fundamental troubleshooting skill for any IT professional.
Will Switching to Fiber Optic Guarantee Low Latency?
Migrating to a fiber optic connection is almost always a significant upgrade. Transmitting data as pulses of light provides dramatically lower latency and superior reliability compared to legacy copper-based technologies like cable or DSL.
However, deploying fiber does not confer immunity from all other sources of latency. While it is an excellent solution for transmission delay, it is only one part of the end-to-end path.
Even with a tier-1 fiber connection, data can still be impacted by:
- The propagation delay over the physical distance to the destination server.
- Congestion on peering or transit networks outside of your provider’s control.
- Inefficient BGP routing or poor peering arrangements further upstream.
Fiber optic is an excellent foundation for a low-latency network, but the entire end-to-end path must be considered.
Ready to stop fighting latency and start mastering your network? The advanced Quality of Service and multi-WAN bonding technologies from Mushroom Networks Inc. give you the power to prioritize critical traffic, overcome unreliable links, and deliver a consistently fast user experience. Explore our solutions at https://www.mushroomnetworks.com to build a more resilient and responsive network.