For any IT professional, a resilient, high-performance network is the foundational infrastructure of the entire organization. When we discuss network performance optimization, we’re not dealing with abstract theories. We are implementing a practical, systematic playbook for leveraging tools like Mushroom Networks routers to build a network that delivers low latency, maximum uptime, and predictable application performance.
A Foundation for High-Performance Networks
Achieving exceptional network performance is not about finding a single solution. It is a systematic process of identifying and remediating weaknesses with targeted, intelligent solutions. For technical staff, this means shifting from a reactive troubleshooting model to a proactive network architecture strategy. The primary objective is to guarantee that critical applications receive the necessary resources, irrespective of network congestion or ISP-related performance degradation.
This process is built on several key pillars, each designed to address common sources of network performance issues. This requires proficiency in diagnosing bottlenecks, implementing an intelligent multi-WAN strategy, and crafting Quality of Service (QoS) policies that reflect specific business priorities.
The Core Pillars of Optimization
Before diving into configuration, a firm grasp of these foundational techniques is essential. Each plays a unique and vital role in architecting a network that is both resilient and efficient.
- Bottleneck Diagnosis: This involves using router analytics to pinpoint the root cause of performance degradation. This could be a bandwidth-intensive application, a failing WAN link, or a device misconfiguration.
- Multi-WAN Load Balancing: This is a key tool for both resilience and aggregate capacity. By intelligently combining multiple internet connections, you can build a robust defense against ISP outages and bandwidth limitations.
- Quality of Service (QoS) Policies: This is where you define traffic prioritization rules. QoS is the mechanism to ensure that real-time, latency-sensitive applications like VoIP and video conferencing are not deprioritized by less urgent traffic, such as large file transfers.
At its core, network performance optimization is about control. It’s the ability to dictate how bandwidth is allocated, ensuring that network resources directly support key business objectives and enhance productivity.
The demand for these skills is expanding rapidly. The global network optimization market is on a trajectory to leap from $5.5 billion in 2025 to a staggering $25.0 billion by 2035. You can see the full market analysis on Future Market Insights. This massive surge is a direct result of increased data generation from cloud computing, IoT devices, and high-resolution video streaming.
Ultimately, successful implementation has a direct and measurable impact on business operations. A highly responsive network reduces operational friction and empowers teams. For a more complete picture, consider how these technical efforts fit into the broader strategy of improving operational efficiency.
To help you keep these concepts straight, here is a summary of the core techniques we’ll be exploring. This table breaks down each pillar, its primary function, and the tangible benefits it brings to IT teams and the organization.
| Core Pillars of Network Optimization on Mushroom Routers |
| :— | :— | :— |
| Optimization Technique | Primary Goal | Key Benefit for IT Teams |
| Bottleneck Diagnosis | Identify and locate the root cause of performance degradation. | Reduces time spent on reactive troubleshooting and enables proactive problem-solving. |
| Multi-WAN Load Balancing | Increase total available bandwidth and provide automatic failover. | Ensures near-100% network uptime and eliminates slowdowns caused by a single ISP. |
| Quality of Service (QoS) | Prioritize critical application traffic over less important data. | Guarantees performance for essential services (VoIP, video) and aligns network usage with business priorities. |
Think of this table as your reference. As you work through the configurations, referencing these pillars will help you stay focused on the “why” behind every action you take, ensuring your efforts lead to a truly optimized and reliable network.
Diagnosing Performance Bottlenecks Like a Pro
To truly optimize network performance, you must first perform a thorough diagnosis. Before deploying any solution, it is critical to identify the root cause of performance degradation. This requires analyzing the data from your Mushroom Networks router to understand the underlying network behavior.

Your router’s dashboard provides a wealth of real-time information, offering a direct view into your network’s health. The key is to translate these metrics into actionable insights. Metrics like latency spikes, packet loss, and jitter are classic indicators of application performance issues, but they are merely symptoms. Your task is to trace these symptoms back to the root cause.
Reading the Vital Signs: Traffic Graphs and Live Data
Your first stop should always be the traffic graph interface. This provides a high-level view of bandwidth utilization across all WAN links, giving you an immediate sense of the network’s load. Look for anomalies. Are there sudden, unexplained spikes in usage? Is one WAN link consistently saturated while others are underutilized?
This initial analysis helps to isolate the problem area. For example, if you observe a massive traffic surge every day at 2:00 PM, you can begin to correlate that with user behavior, such as a scheduled cloud backup or a large data sync. This is your first major clue.
From that high-level view, it’s time to get granular with the live session data. This is where you can see every single active connection flowing through the router. You can usually sort this information by several key metrics:
- Source/Destination: Identify which devices on your network are the top talkers.
- Application Type: Determine if a specific service, like a streaming platform or a cloud backup tool, is the source of the high traffic.
- Bandwidth Usage: Obtain a real-time leaderboard of the most resource-intensive sessions.
This level of detail is critical. You might find that poor VoIP quality is not due to overall network congestion, but rather a single user running a massive, unauthorized backup during business hours.
Common Bottleneck Scenarios and How to Trace Them
Let’s walk through a couple of real-world scenarios you are likely to encounter. Familiarizing yourself with these patterns will make your diagnostic work much faster and more effective.
Scenario 1: The Jittery Video Conference
- The Symptom: Users report that video calls are constantly freezing and the audio is choppy, particularly during peak business hours.
- Diagnostic Steps:
- Begin by checking the overall bandwidth utilization on your traffic graphs. If utilization is consistently high (e.g., over 85%), general congestion is a likely suspect.
- Next, drill down into the live session data and filter specifically for traffic from your video conferencing application.
- While there, look for other high-bandwidth sessions running concurrently. You might discover that non-critical traffic, like a large software update being pushed to several PCs, is competing for resources and creating jitter.
Scenario 2: The Slow Cloud Application
- The Symptom: Accessing the company’s cloud-based CRM is extremely slow, but general web browsing appears to be unaffected.
- Diagnostic Steps:
- Inspect the latency and packet loss metrics for each of your individual WAN links. A single, poorly performing ISP connection could be the bottleneck.
- It’s possible your router is routing critical CRM traffic over a high-latency link by default.
- Confirm this by checking the live session data for the CRM. Note which WAN link it’s using. This provides the necessary information to create a QoS or routing policy that forces this traffic over a more stable connection.
The objective of diagnostics is to gather empirical evidence. You want to move from stating “the network is slow” to stating, “latency on our primary fiber link spikes by 70ms every time the cloud backup service runs, which degrades CRM performance for the sales team.”
When tackling network performance issues, a structured process is crucial. It’s worth exploring key Incident Management Best Practices to give your response a solid framework. This kind of systematic approach transforms a chaotic troubleshooting exercise into a controlled investigation, leading to faster, more permanent resolutions for your network.
Implementing Multi-WAN Load Balancing for True Resilience
Operating with a single internet connection introduces a critical single point of failure, a risk most IT professionals cannot afford. This is where we implement multi-WAN load balancing on your Mushroom Networks device, building a network that is not only resilient but also has significantly more aggregate capacity.
This goes beyond basic failover, where a backup link activates only when the primary one fails. We are talking about intelligent, aggregated performance that utilizes all available bandwidth concurrently. The demand for this type of robust connectivity is growing. The market for network optimization services, valued at USD 5.9 billion in 2024, is expected to jump to USD 19.3 billion by 2033. This surge shows just how critical it is for businesses to maintain constant, high-quality connections.
Session-Based vs. Packet-Based Distribution
At the heart of any multi-WAN strategy on a Mushroom Networks router are two core methods for handling traffic: session-based load balancing and packet-based bonding. The correct choice depends on the type of traffic you need to support.
- Session-Based Load Balancing: This approach is straightforward. It takes each new user session—such as a web request or a file download—and assigns it to the best available WAN link at that moment. It’s incredibly efficient for general web surfing and bulk data transfers.
- Packet-Based Bonding (Broadband Bonding): This is the more sophisticated technique. The router dissects individual sessions down to the packet level, distributes these packets across all available WAN links simultaneously, and then reassembles them at the destination.
To conceptualize this, think of session-based balancing as a multi-lane highway where each car (session) is directed to the least congested lane. Packet-based bonding is like disassembling a vehicle, sending its parts down every lane at once, and reassembling it at the destination for the fastest possible transit time.
This is a great visual for how combining multiple connections boosts your overall bandwidth.
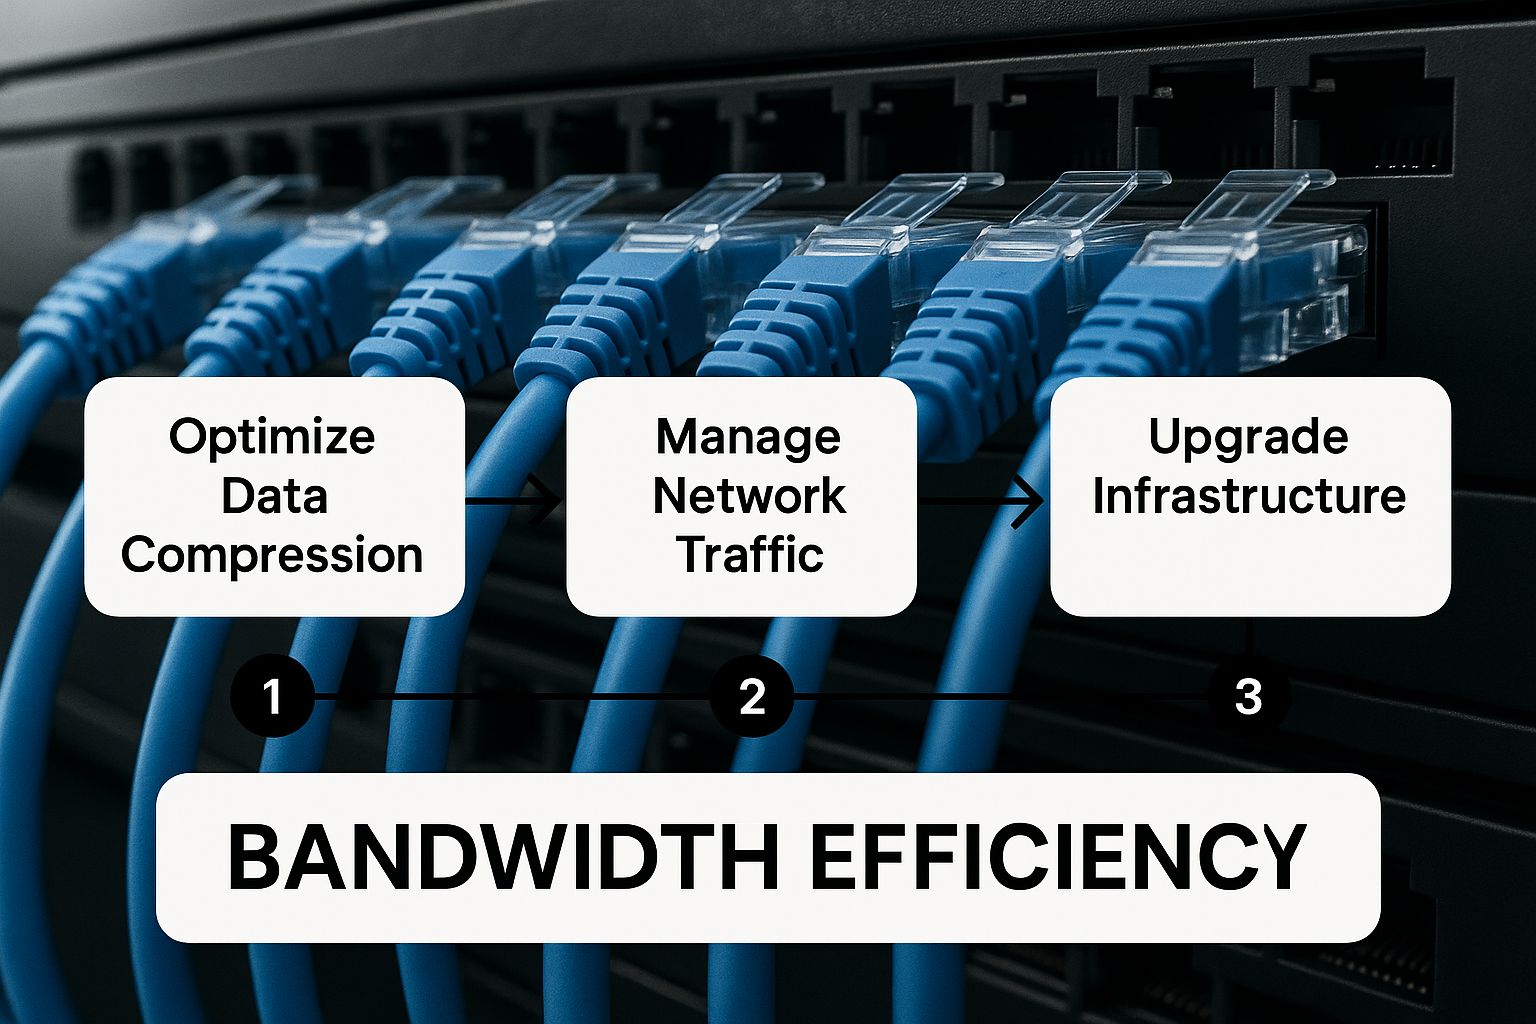
It perfectly illustrates the core principle of multi-WAN: aggregating different connections to create a more powerful, reliable whole.
Choosing the Right Algorithm for Your Traffic
The real effectiveness comes from applying these methods to specific, real-world scenarios. It is not a one-size-fits-all solution, and selecting the wrong algorithm can result in suboptimal network performance.
For the bulk of daily office traffic—web browsing, email, and cloud file-syncing—session-based load balancing is your go-to. It does an excellent job of distributing the load without adding unnecessary overhead. Plus, by keeping each session on a single link, it avoids issues with stateful services like online banking portals that require a consistent source IP address. You can get a deeper look at the mechanics in our guide explaining what network load balancing is.
But when real-time, latency-sensitive applications are on the line, Broadband Bonding is the superior choice.
| Use Case | Recommended Algorithm | Why It’s the Best Choice |
|---|---|---|
| VoIP and Video Conferences | Packet-Based Bonding | Distributes packets across links to smooth out jitter and mitigate packet loss from any single connection, ensuring call clarity. |
| Remote Desktop (RDP/VNC) | Packet-Based Bonding | Creates a single, high-bandwidth virtual pipe that results in a smooth and responsive remote experience. |
| General Web Browsing | Session-Based Balancing | Boosts total throughput for numerous simultaneous users without the overhead of packet-level management. |
| Large File Downloads | Session-Based Balancing | Maximizes download speed by allowing different download sessions to run across multiple ISP links concurrently. |
Practical Configuration for Diverse ISP Links
Let’s walk through a common scenario. Imagine your office has a primary 1Gbps fiber line, a 300Mbps cable connection for backup, and a 5G wireless link for an additional layer of redundancy. The goal is to aggregate these into a single, highly available connection.
Within your Mushroom Networks device, you would begin by configuring Broadband Bonding specifically for your real-time traffic. This entails creating a policy that identifies traffic from VoIP phones and video conferencing applications (like Zoom or Teams) and funnels it through the bonding tunnel. This tunnel combines the fiber, cable, and 5G connections into one resilient, high-speed path. If the fiber connection suddenly experiences high latency, packets are instantly rerouted over the other two links without any noticeable impact on the call.
For all other traffic—general web browsing, emails, and less critical cloud apps—you would apply a session-based load balancing policy. The router will intelligently distribute these sessions across the fiber and cable links based on which has the most available capacity at any given moment. This maintains a fast internet experience for all users without expending the processing overhead of packet bonding on traffic that does not require it. It’s this kind of dual-strategy approach that truly defines effective network performance optimization.
Crafting QoS Policies That Actually Work
Once you have established network resilience with multi-WAN balancing, the next critical step is to instruct your router on traffic prioritization. Not all data packets are of equal importance.
A packet for a video conference that is delayed by even a few milliseconds is effectively useless. Conversely, a packet for a large file download can be retransmitted with no perceptible impact. This is the entire premise behind Quality of Service (QoS).
Effective QoS is more than simply enabling a default VoIP prioritization setting. It involves granular rule creation. On a Mushroom Networks router, you have the power to build precise rules that actively protect your most important business applications. This means you can guarantee bandwidth for critical cloud services like Salesforce or Microsoft 365, ensuring they remain responsive, while simultaneously rate-limiting non-essential, bandwidth-intensive traffic.
Beyond Basic VoIP Prioritization
The days of only giving VoIP the priority lane are over. Modern business operations depend on a wide array of real-time cloud applications. Your QoS strategy must reflect this reality. The objective is to create a traffic hierarchy based on business impact, not merely on application type.
Think of it as creating dedicated traffic classes on your network.
- Priority Queue: Your mission-critical services—like video calls and core SaaS platforms—are assigned to an exclusive, high-priority queue.
- Default Queue: Standard business traffic flows in the default queue, receiving sufficient resources for normal operation.
- Best-Effort Queue: Non-essential traffic, such as social media or personal video streaming, is moved to a lower-priority queue to prevent it from causing congestion for critical applications.
This type of intelligent traffic management is becoming essential. The market for optimizing networks, heavily driven by QoS, is seeing massive investment. In North America alone, this market was valued at USD 10.2 billion in 2024 and is projected to hit USD 23.41 billion by 2033. This growth is a direct result of companies realizing they must invest in technologies to guarantee application performance. You can dig into the full analysis on Business Research Insights.
A Real-World Scenario: The Case of the Choppy Video Call
Let’s get practical. I once worked with a marketing agency that was constantly battling choppy video calls, especially during important client presentations. They had a solid multi-WAN setup with ample bandwidth, and initial diagnostics did not reveal any obvious bottlenecks. This is a classic QoS problem.
Their network was treating a high-stakes client video call with the same priority as a designer syncing a 10 GB video file to a cloud drive. When both occurred simultaneously, the video call would stutter and lag, suffering from jitter and packet loss because it was competing for resources on a first-in, first-out basis.
To resolve this, we needed to implement a granular rule. Here’s the approach:
- Identify the Traffic: First, we had to pinpoint the video conferencing traffic. This is typically done by application signature, but can also be achieved using port numbers (e.g., UDP ports for Zoom or Teams) or the destination IPs of the conferencing service.
- Create the QoS Rule: Within the Mushroom Networks interface, we created a new QoS policy. This rule classified any traffic matching the video conference signature as “High Priority” or “Real-Time.”
- Guarantee Bandwidth: This is the most important step. We guaranteed a certain percentage of bandwidth for this traffic class. For instance, you might reserve 20% of your total bandwidth exclusively for real-time traffic, ensuring it’s always available, even when the rest of the network is under heavy load.
- Manage Other Traffic: Concurrently, we created a “Low Priority” or “Best Effort” class for known bandwidth consumers, like cloud storage sync clients or software update services. This rule does not block the traffic; it simply ensures it can only use bandwidth that is not consumed by higher-priority applications.
A well-crafted QoS policy acts as a traffic controller for your network. It doesn’t just prioritize; it actively protects critical application performance by ensuring resources are allocated based on business rules, not just network demand.
Verifying Your QoS Policies Are Working
After deploying your new QoS policy, the job isn’t done. You must verify that it is functioning as intended. Return to your router’s reporting and analytics tools. You should now see traffic from your video conferencing app correctly classified in the high-priority queue.
More importantly, monitor the performance metrics for that specific queue. The packet loss and jitter for that traffic class should approach zero, even when overall network utilization is high.
The ultimate test, of course, is user feedback. The marketing team should report a significant improvement in call quality, confirming that your policy is effectively shielding their critical communications from network congestion. For a more detailed walkthrough, check out our expert guide to Quality of Service setup on SD-WAN routers. This hands-on approach directly boosts productivity and user satisfaction, turning your network from a source of frustration into a reliable business asset.
Establishing a Proactive Monitoring and Tuning Routine
Network optimization is not a one-time configuration task. True mastery comes from shifting from reactive troubleshooting to a proactive cycle of monitoring, analysis, and tuning. This is the difference between being a network firefighter and a strategic network architect, using the rich data from your Mushroom Networks router to anticipate and prevent problems.
The goal is to build a solid, repeatable workflow that leverages the reporting and analytics tools at your disposal. This means moving beyond a simple “is the internet up?” check and digging into long-term performance data to forecast future needs and refine your configurations.

From Reactive Alerts to Meaningful Insights
Any basic monitoring system can alert you when a WAN link goes down. While useful, this is a reactive signal—the problem has already occurred. A proactive approach involves setting up more intelligent alerts that warn you of performance degradation before it escalates into a full-blown outage.
Think of it as establishing an early warning system. Configure alerts for events that signal growing stress on your network, giving you time to investigate before users are impacted.
Some key proactive alerts I always recommend configuring:
- Sustained High Latency: Trigger an alert if latency on a primary WAN link exceeds a defined threshold (e.g., 50ms) for more than five minutes. This is often the first indicator of ISP congestion.
- Elevated Packet Loss: An alert for packet loss that consistently exceeds 1% on any link can indicate a failing connection or a physical line issue long before the link drops entirely.
- Excessive Jitter: For real-time applications like VoIP, an alert when jitter spikes past 20ms can help you resolve issues that would otherwise lead to poor call quality.
These alerts are a game-changer. You’re no longer just monitoring up/down status; you’re monitoring the quality of the connection, which is what ultimately impacts end-user experience.
Building and Using a Performance Baseline
How do you determine if your changes are effective? You need a benchmark. Establishing a performance baseline is the single most effective way to quantify the impact of your efforts, whether you’re deploying a new QoS policy or adjusting a load-balancing algorithm.
Start by capturing performance data over a typical business week to establish a clear picture of “normal” network behavior. Your baseline report should include crucial metrics for your most important applications and all your WAN links.
Essential metrics for your baseline should include:
- Average and peak bandwidth utilization across all WANs.
- Latency, packet loss, and jitter figures for each individual link.
- Application-specific metrics, like the Time to First Byte (TTFB) for your critical cloud services.
With this baseline established, every change you make can be measured against it. Did the new QoS rule reduce jitter for VoIP traffic during peak hours? The data will provide a definitive answer, replacing subjective assessment with hard evidence.
A baseline isn’t just a snapshot in time; it’s your network’s health record. It allows you to prove the value of your work and make data-driven decisions about future investments and configuration changes.
This ongoing process of measurement and validation is what separates amateur network tweaks from professional network management.
Analyzing Long-Term Trends for Strategic Planning
Your router’s long-term performance data is effectively a tool for capacity planning. By analyzing trends over weeks and months, you can accurately forecast future requirements and make strategic decisions instead of reactive, last-minute upgrades.
I recommend scheduling a weekly or bi-weekly performance review. This does not have to be time-consuming, but during this period, you should specifically look at the historical data for emerging patterns.
- Is overall bandwidth usage trending upward? A consistent 5-10% month-over-month increase is a clear signal that it’s time to budget for a bandwidth upgrade—before performance degradation occurs.
- Are new applications consuming significant resources? If the company recently deployed a new cloud-based CRM, you will likely see its impact on the network. This might necessitate an adjustment to your QoS policies.
- Is one WAN link consistently underperforming? If your secondary ISP link consistently shows high latency or packet loss, the data provides the evidence needed to re-evaluate that service contract. For a deeper dive on this topic, check out our guide on how to reduce WAN latency for real-time applications.
This kind of proactive analysis elevates your role. You move beyond day-to-day fixes and become a strategic partner to the business, ensuring the network is always prepared to support its growth.
Even with the best tools and a solid game plan, you’re always going to run into practical questions during a network performance optimization project. It just comes with the territory. This section dives into some of the most common queries we hear from IT pros working with Mushroom Networks devices, offering clear, real-world answers to help you make the right configuration choices.
How Do I Decide Between Session-Based and Packet-Based WAN Bonding?
This is a classic question, and the answer really boils down to your specific traffic profile.
For anything real-time and sensitive to latency—think VoIP, video conferences, or remote desktop sessions—packet-based bonding is your go-to. It’s designed to create a single, much faster, and incredibly resilient connection by intelligently spreading individual packets across every WAN link you have. It’s all about quality of experience for that one critical stream.
On the other hand, for general web browsing, hefty file downloads, or other non-critical cloud services, session-based load balancing is usually plenty. It’s a simpler, highly efficient method that just assigns each new user session to the best link available at that moment. This is perfect for boosting overall throughput without the slight overhead that comes with managing things at the packet level.
Here’s a simple way to think about it: Packet-based bonding is like having a dedicated, multi-lane express highway for a VIP convoy. Session-based balancing is like an expert traffic cop directing all the individual cars to the least congested routes to keep everything moving.
Can QoS Policies and WAN Load Balancing Conflict?
Nope, they’re actually designed to work in perfect harmony. With Mushroom Networks devices, the Quality of Service (QoS) policies are always applied before the traffic ever gets to the WAN bonding or load-balancing engine.
This two-step process ensures your most important applications get the best of both worlds:
- Prioritization: First, QoS inspects and classifies your traffic, flagging high-priority applications like VoIP to go to the front of the line.
- Distribution: Then, the load balancing engine takes that already-prioritized traffic and smartly distributes it across all your available WAN links for maximum speed and reliability.
So, your critical apps don’t just get priority on the network—they also get to ride on the combined speed and resiliency of all your internet connections. The key is to let QoS handle the “what” (what’s important) and let load balancing handle the “how” (how to send it).
What Are the First Signs I Need to Re-Evaluate My Optimization Strategy?
The most obvious sign is a sudden increase in user complaints about application performance, especially for services that used to work flawlessly. If you start hearing about choppy video calls, slow cloud app access, or dropped connections, those are your primary red flags.
From a more technical angle, keep an eye on your router’s dashboard for these leading indicators:
- Rising latency or jitter on your main WAN links.
- Consistently high bandwidth usage, like creeping over 85% during peak business hours.
- An increase in failover events, meaning your primary links are becoming less stable.
These symptoms are a strong hint that your traffic patterns have changed or your current setup just can’t keep up with demand anymore. That’s your cue to circle back to your bottleneck analysis and fine-tune those QoS policies.
Ready to eliminate lag, downtime, and poor application performance? Mushroom Networks provides the powerful multi-WAN bonding and SD-WAN solutions you need to build a faster, more resilient network. Discover how our technology can transform your connectivity at https://www.mushroomnetworks.com.