
This FAQ discusses the Mushroom Diagnostic tools as follows:
- Setup for Linux
- Setup for Windows
- Interface names for various Mushroom models
- Diagnostic commands examples for ping, tcpdump, traceroute
LINUX SETUP
- Login as user (not root) to the local machine, which will be used to access the Mushroom device
- Generate public and private RSA keys, which will be used to login to the diagnostic shell for the device. Run the following commands from the users home directory /home/user/ :
- mkdir ~/.ssh
- chmod 700 ~/.ssh
- ssh-keygen -t rsa
- Generating public/private rsa key pair.
- Enter file in which to save the key (/home/user/.ssh/id_rsa):
- Enter passphrase (empty for no passphrase):
- Enter same passphrase again:
- Your identification has been saved in /home/user/.ssh/id_rsa.
- Your public key has been saved in /home/user/.ssh/id_rsa.pub.
- Enter the passphrase which will be used for login
- Open the public key using vi /home/user/.ssh/id_rsa.pub. It will be something similar to
- ssh-rsa AAAAB3NzaC1yc2EAAAADAQABAAABAQDAj0K5c7qq230mMocRxMamoTeK mvT9k2xaFqvY2a8hd/hfUF+tGhxLgyWWNlizVkEN/J/Bo22QMbxInivRUBuPsSGr cohhOFZn2nq831UVZUISjiqCJxLLbGrQNUbohqlY+OzI+KzbWEVhCD+rcPBjSO Sl69on+kVlU/5BQqezlevD+jXBt+6e+JNd30DyNAaMr9eh user@Hostname
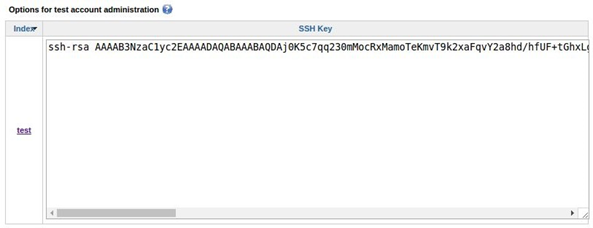
- Copy the whole string and paste it to”Options for test account administration” under the “Extra” tab on the UI. It can be pasted by clicking on the test link.
- To display the “Extra” tab, change the URL on the web browser to point to <IP address of Mushroom unit> and add ‘extra.html’, usually 192.168.254.99/extra.html.
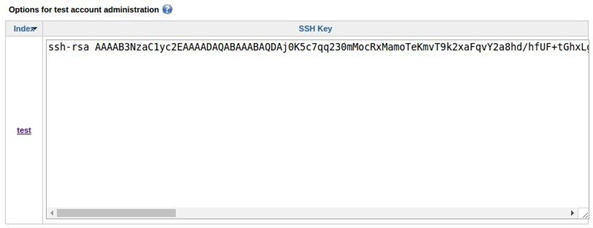
- Once done you can now login to the diagnostic tool using the following command:
- ssh test@<IP of the mushroom device> -p 7022
- When prompted for a password enter the password set on generating the keys.
You should now be able to access the diagnostic tool.
WINDOWS SETUP
- Install PuTTY
- Open PuTTYgen to generate the public and private key.
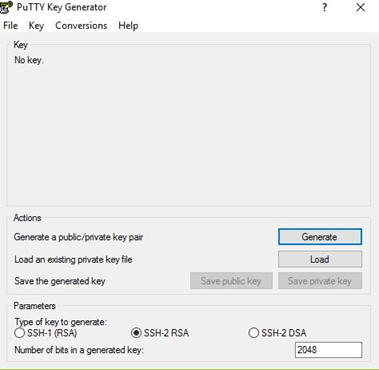
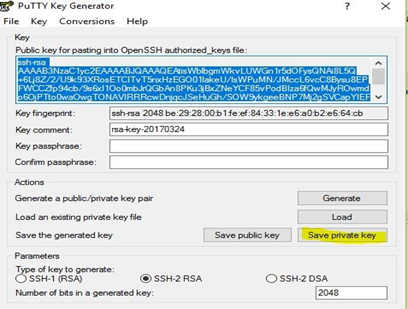
- Type in the key phrases which will be used to login to the box. Click on the “Generate” option to generate the keys. Create the randomness by moving the mouse in the white area. (If you don’t see the SSH-2 RSA option, please choose RSA.)
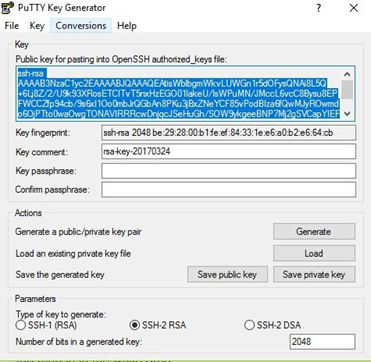
- Copy the highlighted public key to the “Options for test account administration”, under the “Extra” tab on the Mushroom GUI and paste it as shown.
- To display the “Extra” tab, change the URL on the web browser to point to <IP address of Mushroom unit> and add ‘extra.html’, usually 192.168.254.99/extra.html.
- Save the private key
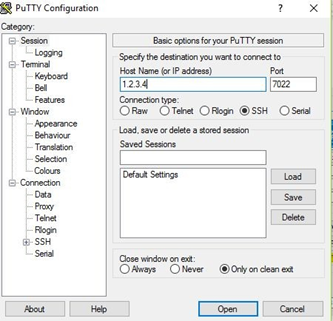
- Open the PuTTY application
- Enter the hostname or IP to access the device
- Enter the port number as 7022
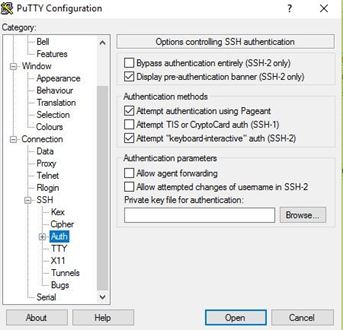
- Expand the ssh option, click on Auth and then add the private key that you saved in the steps before, and click open.
- Login as “test” and enter the passphrase entered earlier when prompted.
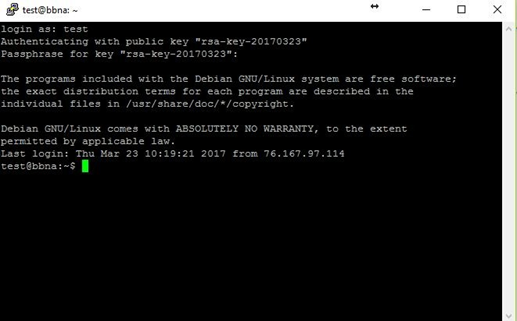
You should now be able to access the diagnostic tool.
Interface Names for Mushroom Models
To identify which Truffle model you have, click on the “Status” tab on the Mushroom User Interface. The second line will list the model name.
To get all the available interfaces on the device run the command “tcpdump -D”. Out the listed interfaces, the interface names starting with vll1-xx correspond to the VLL2 tunnels under the VLL tab i.e VoIP Armor, lb-tunnel etc. The interface names starting with tun100-xx correspond to the VLL tunnels seen on the HOME tab. The follow is an example similar to the list that you might see:
1.eth0 [Up, Running]
2.br0 [Up, Running]
3.tun100-0 [Up, Running]
4.empty0 [Up, Running]
5.tun-eth0 [Up, Running]
6.vll1-0 [Up, Running]
7.eth1 [Up, Running]
8.ifb1 [Up, Running]
9.eth2 [Up, Running]
10.eth4 [Up, Running]
11.tun-eth4 [Up, Running
Here is how our WAN and LAN interfaces are mapped to the device names for various Mushroom models:
Truffle Lite (2 port)
LAN1: eth0
LAN2: eth1
WAN1: eth2
WAN2: eth3
Truffle 4000 (4 port)
LAN1: eth1
LAN2: eth2
WAN1: eth0
WAN2: eth3
WAN3: eth4
WAN4: eth5
Truffle 8000 (8 port)
LAN1: eth5
LAN2: eth6
WAN1: eth4
WAN2: eth7
WAN3: eth8
WAN4: eth9
WAN5: eth10
WAN6: eth11
WAN7: eth12
WAN8: eth13
Truffle E (8 port)
LAN1: eth1
LAN2: eth2
WAN1: eth0
WAN2: eth3
WAN3: eth4
WAN4: eth5
WAN5: eth6
WAN6: eth7
WAN7: eth8
WAN8: eth9
Truffle EC (16 port)
LAN1: eth9
LAN2: eth10
WAN1: eth8
WAN2: eth11
WAN3: eth12
WAN4: eth13
WAN5: eth14
WAN6: eth15
WAN7: eth16
WAN8: eth17
WAN9: eth0
WAN10: eth1
WAN11: eth2
WAN12: eth3
WAN13: eth4
WAN14: eth5
WAN15: eth6
WAN16: eth7
Truffle EX (12 port)
LAN1: eth13
LAN2: eth12
WAN1: eth11
WAN2: eth10
WAN3: eth9
WAN4: eth8
WAN5: eth7
WAN6: eth6
WAN7: eth5
WAN8: eth4
WAN9: eth3
WAN10: eth2
WAN11: eth1
WAN12: eth0
Diagnostics Commands Examples (ping, tcpdump, traceroute & iperf3)
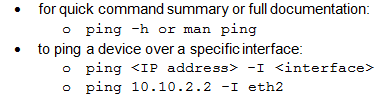
ping – send ICMP ECHO_REQUEST to network hosts
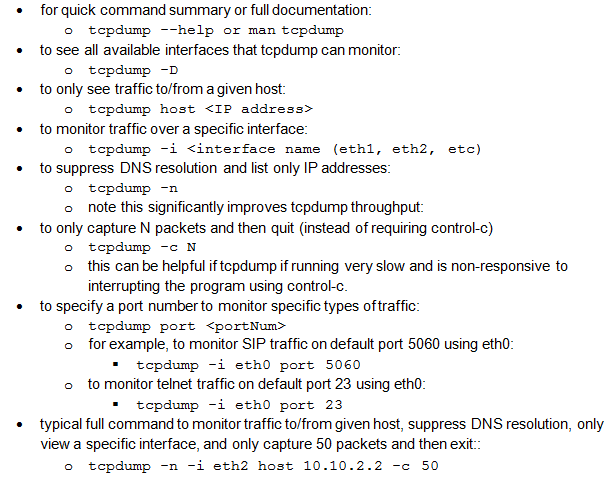
tcpdump – dump traffic on a network
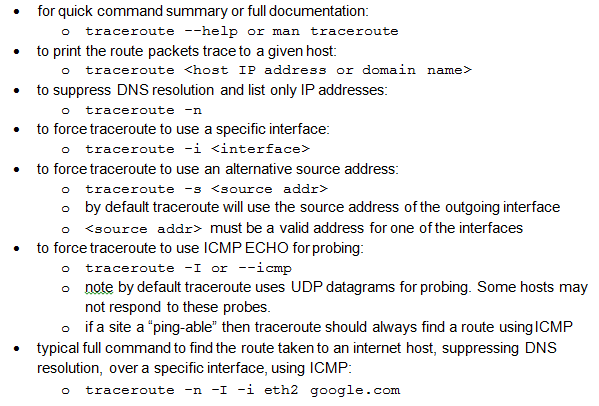
traceroute – print the route packets trace to network host
iperf3 commands:
- Command to run a test for 100 secs to a server (running iperf3 server instance), binding it to a WAN interface IP address on the Mushroom unit:
- Downlink test: iperf3 -c <remote_server_IP> -t 100 -R -B <local_WAN_interface_IP>
- Uplink test: iperf3 -c <remote_server_IP> -t 100 -B <local_WAN_interface_IP